Following is an outline of tasks necessary to prepare for debugging
Set up Server connection setting
Prepare process definition
Create debug configuration
Set up Server connection setting
Use the following procedure for the debugging flow.
From the menu items Window select Preferences. Preferences window will be displayed
Select Server connection settings from Interstage BPM Studio tree and define the Management Server to be used.
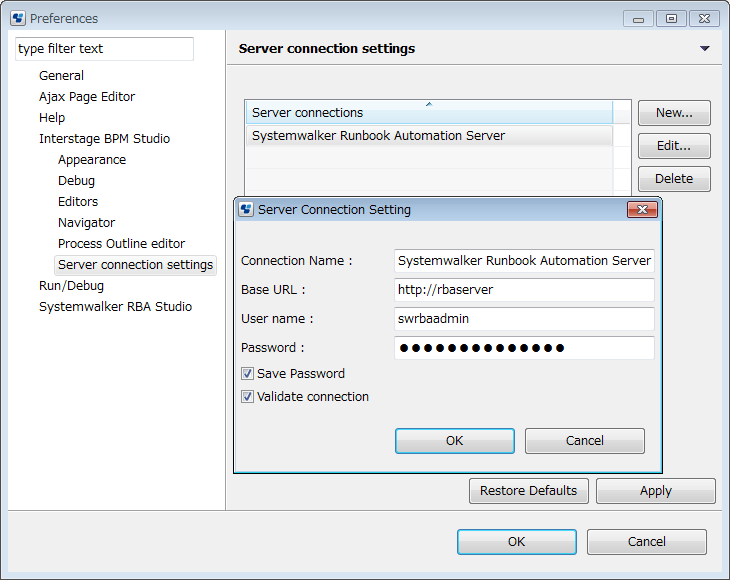
Connection name: Specify a name to identify the connection. Any name can be specified.
Base URL: This is the URL used to connect to the Management Server. Specify the base URL using the following format:
http://<hostname>:<port>
In the URL example below, "rbaserver" is used for the hostname and "80" is used as the port.
http://rbaserver:80
User name: Specify the name of the user with administrator privileges that can execute operations such as the generation of process instances.
Password, save password: To save a password so that it does not need to be entered at the time of connection, specify the password in this dialog box then select Save Password. If the password is not saved, it will need to be entered each time there is a connection.
Validate connection: select to verify the connection when OK is clicked.
For details about server connection settings, refer to "2.4.1 Server Connection Settings" in Chapter 2, "Basic Information and Customization for the User Interface".
Prepare process definition
Make the process definition on the workspace identical to the process definition on the Management Server.
If the debugging target process definition on the workspace is new, or there is no process definition on the Management Server, upload a process definition to the Management Server. Refer to "3.1.15 Uploading Workflow Application Projects to a Server" for information on how to upload the process definition.
If there is no debugging target process definition on the workspace, or the process definition is old, download a process definition from the Management Server. Refer to "3.1.14 Downloading Workflow Application Projects from a Server" for details.
Make sure that process definition has the following attributes
Status:
Draft
Owner:
Is the user set in "Set up Server connection setting".
Note
To debug the process definition, the process definition name and process definition file name must match.
Create debug configuration
Open the menu items Run >> Debug Configurations.
This can also be opened by clicking the ![]() on
on ![]() (the Debug button) on the toolbar, then selecting the Debug Configurations menu.
(the Debug button) on the toolbar, then selecting the Debug Configurations menu.
While Work Flow Application is selected on the tree, click the New launch Configuration button from the top part of the tree (this button is on the very left). Alternatively, while Work Flow Application is selected on the tree, open the context menu then select the New menu.
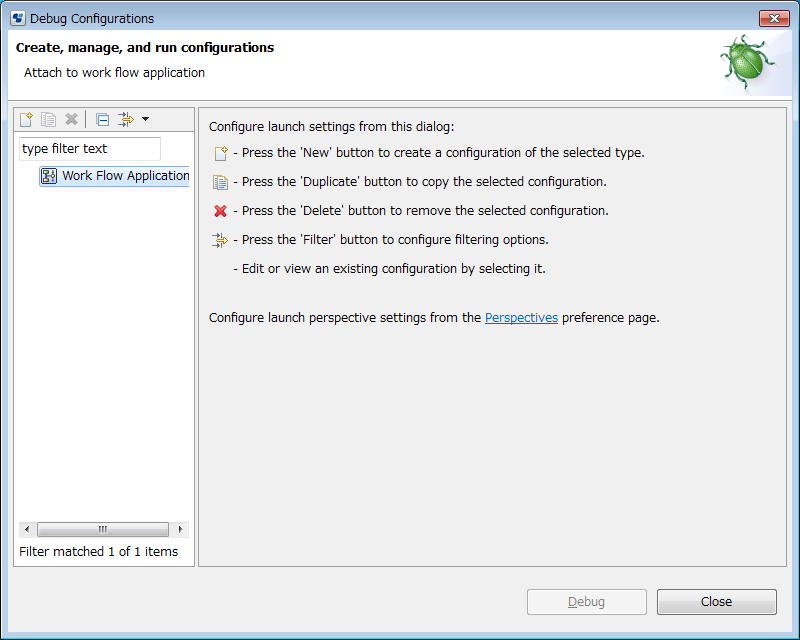
The new debug configuration used in Work Flow Application debug configuration is displayed to the right of the dialog box.
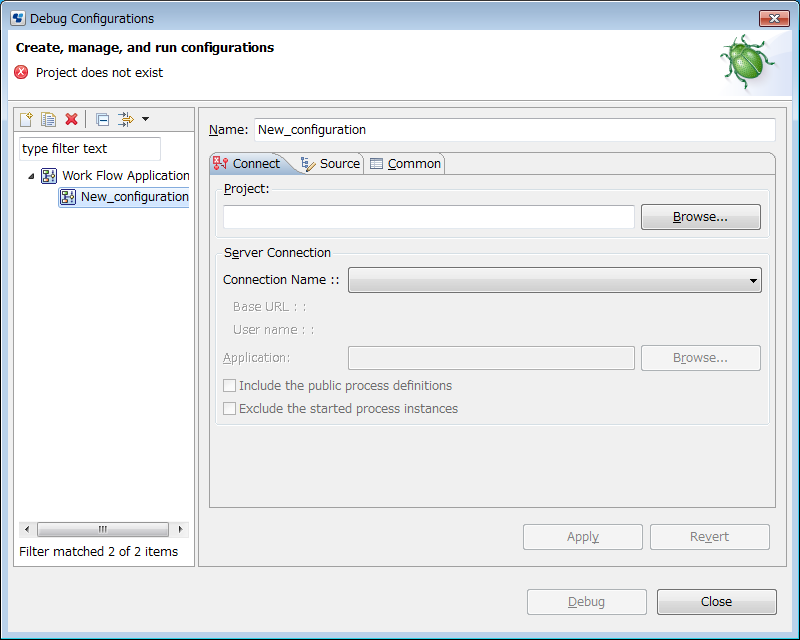
In the Name field, specify the name which will be attached to the debug configuration. This name must be unique, and should be easy to remember.
In the Project group, specify the project containing the process definition to be debugged.
This can also be selected and specified using the Browse button.
From the Connection Name combo-box, select the connection name which was defined in "Set up Server connection setting".
Application field refers to application on management server containing the process definition to be debugged. Selecting Application is optional. Press Browse to select Application.
Point
If Application is not set, searching for process definitions may take time since all the process definitions on management server will be searched. To narrow down the search and shortening the search time you can set the Application. If Application is set, searching for only process definitions which is contained in Application. Included. You can shorten the amount of time to make debug possible by setting Application.
The time until debugging becomes possible can be further reduced by selecting the Exclude the started process instances checkbox.
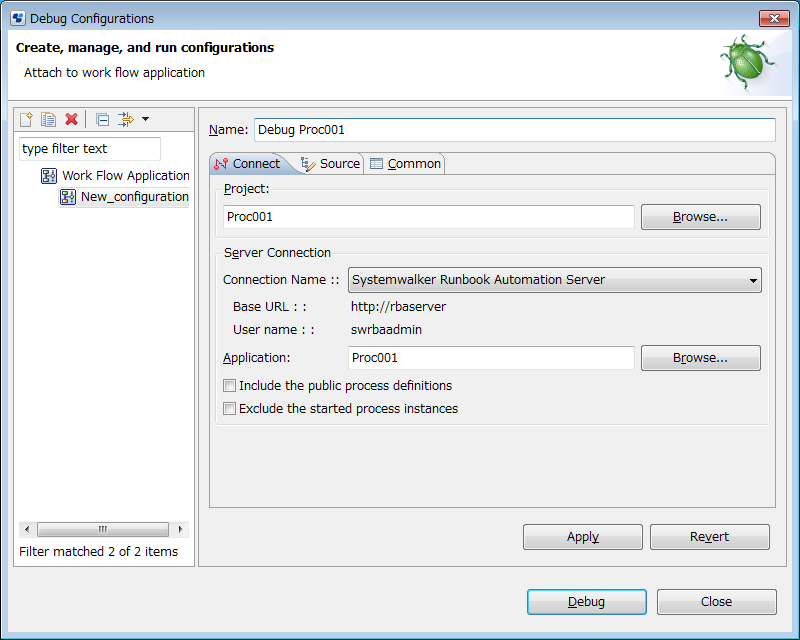
Click the Debug button to connect to the server and start the debugging.
The Debug Configurations dialog box closes, and the workbench window configuration switches to the Debug perspective.