

| ETERNUS SF Storage Cruiser User's Guide 13.2 - Solaris (TM) Operating System / Linux / Microsoft(R) Windows(R) - |
|
Contents
Index
|
This product supports performance management functionality for fibre channel switch and ETERNUS disk array devices. This functionality enables users to get details about the operation and load statuses of devices. However, this product does not support performance management functionality in relation to the ETERNUS disk array device main frame volume, MVV and SDV.
The performance information can be referenced using Systemwalker Service Quality Coordinator. However, some performance information is not supported. For details, refer to the Systemwalker Service Quality Coordinator manual.
For details about supported devices, refer to "1.3.5 Support levels".

Do not execute performance monitoring for a single device from more than one administrative server(*) at the same time.
* The Softek Storage Cruiser administrative servers, the ETERNUS SF Storage Cruiser administrative servers or the Systemwalker Resource Coordinator administrative servers
The performance management functionality always starts up when the administrative server starts up. For devices in which performance management settings have been configured, performance information collection starts in the background. Accordingly, performance information is collected regardless of whether GUI window display. To stop performance information collection, execute performance management stop processing.
The following information can be managed: Performance monitoring can be set at different intervals, refer to "7.2.3 Setting Monitoring Intervals" for the settings available for each device.
Fibre Channel switch
| Performance information (Unit) | Fibre Channel switch | |
| Port | Transfer rates of send/receive data (MB/S) | supported |
| Number of CRC errors | supported |
ETERNUS disk array device
| Performance information (Unit) | ETERNUS8000 ETERNUS4000 (Except ETERNUS4000 model 80/100) |
ETERNUS6000 | ETERNUS4000 model 80/100, ETERNUS3000 (Except model 50), ETERNUS GR series (ETERNUS GR720 or higher) |
ETERNUS2000 | |
| LUN LogicalVolume RAIDGroup |
Read count and write count (IOPS / IO per second) | supported | supported | supported | supported |
| Read and write data transfer rate (MB/S) | supported | supported | supported | supported | |
| Average response time for read and write (msec) | supported | supported | supported | supported | |
| Read, pre-fetch, and write cache hit rate (%) | supported | supported | supported | supported | |
| Disk drive | Disk busy rate (%) | supported | supported | supported | supported |
| CM | Load (CPU usage) rate (%) | supported | supported | supported | supported |
| Copy remaining amount (GB) | supported | supported | not supported | supported | |
| CA | Load factor (CPU usage rate) (%) | not supported | supported | not supported | not supported |
| Read count and write count (IOPS / IO per second) | supported | supported | not supported | not supported | |
| Read and write data transfer rate (MB/S) | supported | supported | not supported | not supported | |
| CM Port | Read count and write count (IOPS / IO per second) | not supported | not supported | not supported | supported |
| Read and write data transfer rate(MB/S) | not supported | not supported | not supported | supported | |
| DA | load factor (CPU usage rate) (%) | not supported | supported | not supported | not supported |
| Read count and write count (IOPS / IO per second) | not supported | supported | not supported | not supported | |
| Read and write data transfer rate (MB/S) | not supported | supported | not supported | not supported |
When RAID Consolidation is performed in ETERNUS6000 the RAIDGroup response time will not be displayed.
Performance information about the RAIDGroup functionality including LogicalVolume(LUN)and LogicalVolume created in LUN Concatenation on the ETERNUS disk array device cannot be displayed.
Performance information about the ETERNUS disk array mainframe volume and MVV/SDV are not supported, and performance information values for RAIDGroup cannot be guaranteed.
On ETERNUS6000 devices, CA performance information relates to the FC-CA or FC-RA port. Furthermore, performance information obtained during the execution of REC and ROPC is displayed as Write performance information, regardless of whether FC-RA port is set up on the Initiator side or the Target side.
This software product also provides graph windows with the following time units:
One-hour Graph window
Based on the time selected as the performance monitoring interval, a line graph for a one-hour period is displayed.
Examples are as follows:
If the performance monitoring interval is 30 seconds, a line graph for a one-hour period with values obtained at an interval of 30 seconds is displayed.
If the performance monitoring interval is 60 seconds, a line graph for a one-hour period with values obtained at an interval of one minute is displayed.
If the performance monitoring interval is 300 seconds, a line graph for a one-hour period with values obtained at an interval of five minutes is displayed.
If the performance monitoring interval is 600 seconds, a line graph for a one-hour period with values obtained at an interval of ten minutes is displayed.
Values displayed on the graph are the mean value of the performance monitoring interval. However the CM copy remaining volume graph displays information obtained at the time the graph was produced.
One-day Graph window
Based on the mean values for 10-minute periods, a line graph for a one-day period is displayed.
One-week Graph window
Based on the mean values per hour, a line graph for a one-week period is displayed.
If the summer time functionality of the operating system is enabled, a part of the graph that is supposed to show the data around the switch to summer time may not be displayed correctly.
Threshold monitoring is supported for fibre channel switch and ETERNUS disk array devices.
The threshold monitoring functionality sends an alarm or report when a storage or switch performance value reaches a certain level (threshold value) under certain conditions in daily transaction operations.
The advantage of using the threshold monitoring is that the symptom of a storage or switch performance drop caused by changes in data processing rates and transaction processing rates can be automatically and reliably detected in daily transaction operations.
The effect that can be expected from the threshold monitoring functionality is that operations in the most suitable environment are enabled. This is accomplished by preventing the adverse effect of performance drops through early detection of bottleneck locations, identification of their causes, and improvement of device configuration.
The threshold monitoring functionality can manage the following information:
Fibre Channel switch
Port throughput (%)
A port throughput value (MB/s) is monitored as the percentage (%) of an allowable tolerance to a maximum transfer capability (MB/s).
ETERNUS disk array device
Response time (msec) of LUN (OLU)
Average use (busy) rate (%) of RAIDGroup (RLU, LUN_R)
CM load (CPU usage) rate (%)
The threshold monitoring functionality provides the Threshold Monitoring Alarm Log and Condition Report windows.
From all devices monitored by the functionality, the Threshold Monitoring Alarm Log window displays a list of threshold monitoring alarm items detected on individual devices.
The Condition Report window provides the following four windows:
Logical Volume response time error
This is displayed if the Logical Volume response time of a monitored device is found to have reached the state specified in threshold settings. Guidelines for actions to be taken are also displayed.
RAID Group load error
This is displayed if the RAID Group utilization of a monitored device reaches the specified state. Guidelines for actions to be taken are also displayed.
CM load error
This is displayed if the CM load ratio of a monitored device reaches the specified state. Guidelines for actions to be taken are also displayed.
Port throughput load error
It is displayed when the transfer/receive usage rate of port of a monitored device reached the specified state. Measures indicator is also displayed.
The threshold monitoring functionality is always started when the administrative server is started, and the functionality starts threshold monitoring and obtaining performance information at the same time for a device for which performance management is specified. Accordingly, performance information is obtained and thresholds are monitored regardless of when display of the GUI window starts. To end threshold monitoring, stop threshold monitoring from this software product.
When a user gives an instruction for performance management of a target device from a GUI window, the performance management unit issues SNMP Traps periodically through a LAN to devices to obtain performance information, and it saves the information as performance data on the administrative server. This software product displays the performance data in the Performance Management window and manages the device.
To conduct performance monitoring, sufficient disk space is required on the administrative server for performance data storage. Make sure that sufficient disk space is ensured referring to the Installation Guide. This software product is capable of deleting performance data overdue the specified holding period. The default is seven days and data exceeded this period are automatically deleted. This period can be modified. To change the number of days to store performance data refer to "7.7 Definition File".
To display the dialog for setting the monitoring state, click the target device in the SAN view of the resource view, and then select [Device(D)]-[Performance management(S)] from the menu or right-click [Performance management] from the popup menu.
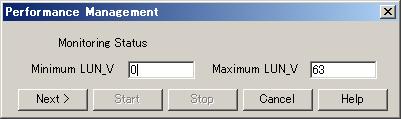
ETERNUS disk array performance management settings window
Fibre Channel switch performance management settings window
In ETERNUS disk arrays, enter the minimum and maximum values for the performance information securement target Logical Volume (LUN_V). Setting LUN can reduce the effect of obtaining performance information on disk areas where performance data is saved and reduce the load. Setting LUN prevents allocation of more space than necessary for Logical Volume. Consequently, the recommended entry for Logical Volume is the minimum value for obtaining performance data.
Do not execute performance monitoring for a single device from more than one administrative server(*) at the same time.
* The Softek Storage Cruiser administrative servers, the ETERNUS SF Storage Cruiser administrative servers or the Systemwalker Resource Coordinator administrative servers
Since performance information is obtained internally in units of 64 for Logical Volume, performance information in the neighboring area of the Logical Volume setting is also obtained. (For example, if a range of 70 to 80 is set for Logical Volume (LUN_V) on the screen, the information of Logical Volume between 64 and 127 is obtained internally.)
If the device configuration has changed, update the device configuration information maintained by the performance management functionality. For details about the update procedure, refer to "7.2.11 Updating configuration information".
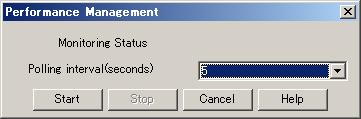
Enter the interval at which performance information is secured in the ETERNUS disk array and Fibre Channel switch common settings. You can specify 5, 10, 30, 60, 300, or 600 seconds as the interval. However, intervals that can be specified vary depending on device models and the number of Logical Volumes indicating performance level being maintained.
|
Monitoring condition |
Specifiable interval |
|
|---|---|---|
|
Device model name |
Number of LogicalVolumes whose performance is maintained |
|
|
ETERNUS4000(M80,100) |
128 or less |
5/10/30/60/300 seconds |
|
129 to 2,047 |
30/60/300 seconds |
|
|
2,048 or more |
60/300 seconds |
|
|
ETERNUS6000 |
64 or less |
10/30/60/300 seconds |
|
65 to 2,047 |
30/60/300 seconds |
|
|
2,048 or more |
60/300 seconds |
|
|
ETERNUS8000 ETERNUS4000(Except for M80,100) |
256 or less |
30/60/300/600 seconds |
|
257 to 1024 |
60/300/600 seconds |
|
|
1025 to 8192 |
300/600 seconds |
|
|
8193 or more |
600 seconds |
|
|
ETERNUS SN200 |
- |
5/10/30/60 seconds |
In LAN traffic or cross-subnet (where there is a gateway between the performance monitoring target device and the administrative server) situations, it may not be possible to obtain the performance information inside the monitoring interval that was set. Please change the monitoring interval when you cannot acquire performance information on each monitoring interval.
When you click [Start] in this dialog, an instruction to obtain performance information is issued to the performance management unit (see the figure in "Flow of Performance Management"), and the performance management unit obtains performance information of the device through the LAN and saves it as performance data. Since the performance management unit is started as a daemon of the administrative server, the unit continues obtaining performance information while the administrative server is active, even if no GUI window is displayed.
The logical configuration of the storage device is recognized, and the obtaining of performance information starts. At the start of obtaining performance information of the selected storage system, an amount of time (tens of seconds to several minutes) is spent to obtain the logical configuration before any performance information is actually obtained.
When performance monitoring starts, the "P" mark appears in green at the upper left of the device icon on the map display. If the Performance Management window is open and the corresponding Fibre Channel switch and storage system are displayed in the tree, the device name is displayed in the same color as that of the "P" mark.

The table below lists "P" mark colors and their corresponding statuses and actions to be taken. The color may differ from that of the current status. Click [Refresh] on the GUI window or press the F5 key to check the latest status.
|
"P" mark color |
Status |
Appropriate action |
|---|---|---|
|
Green |
Performance is being monitored. (Normal) |
Performance is being monitored. |
|
Yellow |
Performance monitoring is being recovered (e.g. device time-out). |
The administrative server cannot communicate with a device. Check the network status and device status. Log off, when ETERNUSmgr/GRmgr is in a login state. |
|
Red |
Writing to the performance information file failed. |
Check the write permission to the file and the capacity of the file system. |
|
Wrong registered password of GR |
Reregister devices with this software product, and restart performance monitoring. |
|
|
Internal error |
Contact a FUJITSU maintenance engineer. |
Start the Performance Management Window to display performance information. To open the Performance Management window, select [File]> [Performance Management Window] from the GUI menu or right-click [Performance Management Window] from the popup menu.
You can display the performance information of a device in the Performance Management window by dragging a device icon displayed in the resource view and dropping it in the Performance Management window. You can create multiple Performance Management windows. Also, multiple device icons can be dropped in a single Performance Management window to display information about those devices.
From the device tree view in the Performance Management window, select and right-click the port number of the Fibre Channel switch whose performance information you want to display, and then select [Show Performance Graph] from the resulting popup menu.
The dialog shown below appears. In the dialog, select the items to be displayed.
|
Time Axis |
Select the time interval for a graph that you want to display. Select one hour, one day, or one week. |
|
Date Specification |
Specify the date and time to be displayed the center of the graph. The current time is displayed. You may select the date and time of a graph that you want to display. A period of up to 7 days can be specified. |
|
Throughput |
Displays a data transfer rate (MB/S). Here, select an information type. Select one of the following three: (1) displaying the graphic window for the transmitting-side performance of a port, (2) displaying the graphic window for the receiving-side performance, and (3) displaying one graphic window where both transmission and reception performances are displayed at the same time. The transmission and reception performances can be selected at the same time but, if the combined transmission-reception performances are selected, neither the individual transmission performance nor the reception performance can be selected. |
|
Error |
Displays the graph of a CRC error count that occurs in the port. |
The window shown below displays a result of selections in the above dialog. One-hour Graph windows of send throughput and receive throughput are displayed. Using the graphs, you can determine the operating status of the port. See "B.10.5 Graph window functions".
To display performance information of multiple ports at the same time, click multiple ports in the tree while holding down the Ctrl or Shift key, and then right-click a selected port to display a graph.
In this case, "Open Window for Every Port" is added to the dialog displayed immediately before a graph is displayed. If you check the check box, one window for each port opens.
If you do not check the check box, you can select "Total of Throughput" in the dialog. If you select it, the total values of the ports are displayed in a graph. Otherwise, values of each port are displayed in the same graph window. Incidentally, if "Send/Receive" is selected, "Total of Throughput" must be selected.
The window shown below is an example where "Open a window for each port" and "Total of Throughput" are not selected. To check the correspondence between ports and lines in the graph in the window, select a button for a line in the graph. In this example, port 14 is frequently used.
When the ETERNUS disk array device icon is dragged and dropped to the performance management window, a storage logic configuration tree will be displayed as below.
"AffinityGroup" indicates a number of the zone functionality of the selected storage system.
"LUN" indicates a logical unit number from the point of view of the server node. Since this is allocated with Logical Volume (OLU and LUN_V) that specifies a number unique to a device managed in the device, this is expressed as "LUN X(Logical Volume X)" in the tree.
"RAID Group" located under "LUN" indicates that LUN is included in "RAID Group" (rank). [Disk](=physical drive) under [RAIDGroup] or [RAIDGroup [X- X]] indicates the drive used to configure the rank. [LogicalVolume] under [RAIDGroup] or [RAIDGroup [X- X]] indicates the numbers of other LogicalVolumes that belong to the same RAIDGroup. [RAIDGroup X- X] also has devices that are not shown.
The properties are displayed as tool tips. For details about items that can be checked in these tool tips, refer to "B.10.3 The tree view".
Figures beginning with "0x" are values expressed in hexadecimal notation. Other numbers are decimal numbers.
From the device tree in the Performance Management window, select the number of the LUN or RAID Group whose performance information you want to display, right-click to display a popup menu, and select [Show Performance Graph].
You can select multiple numbers. To do so, click LUN or RAID Group while holding down the Ctrl or Shift key, right-click and slect [Show Performance Graph].
The dialog shown below appears. In the dialog, select the graph window to be displayed.
|
Time Axis |
Select the time interval for a graph that you want to display. Select one hour, one day, or one week. |
|
Date Specification |
Specify the date and time to be displayed in the center of the graph. The current time is displayed. You may select the date and time of a graph that you want to display. A period of up to 7 days can be specified. |
|
IOPS |
Indicates how many times I/O is issued per second. |
|
Throughput |
Displays a data transfer rate (MB/S). |
|
Response time |
Displays an average I/O processing time (ms). |
|
Cache hit rate |
Displays a ratio (%) at which cache is hit. |
When RAID Consolidation is performed in ETERNUS6000 the RAIDGroup response time will not be displayed.
Performance information about the RAIDGroup functionality including LogicalVolume(LUN)and LogicalVolume created in LUN Concatenation on the ETERNUS disk array device cannot be displayed.
The ETERNUS disk array mainframe volume and performance information about MVV/SDV are not supported. The value for the performance information about the RAID Group containing SDV also cannot be guaranteed.
* For the IOPS, throughput, and response time, one of the following three can be selected: (1) displaying a READ graphic window, (2) displaying a Write graphic window, and (3) displaying one graphic window where R/W (Read and Write information) items are displayed at the same time. Read and Write can be selected at the same time but, if R/W is selected, the individual Read and Write graphic windows cannot be selected.
* For the cache hit ratio, one of the following four can be selected: (1) displaying a Read hit-ratio graphic window, (2) displaying a Write hit-ratio graphic window, (3) displaying a pre-fetch hit-ratio graphic window, and (4) displaying one graphic window where all R/W/P information (Read, Write, and Pre-fetch hit ratios) is displayed at the same time. Read, Write and pre-fetch can be selected at the same time but, if R/W/P is selected, the individual Read, Write, and pre-fetch graphic windows cannot be selected.
If multiple logical units are selected be displayed on a graph, "Open Window for Every LUN" is displayed. Select it to open one graph window for each LUN.
If it has not been selected, "Total" is displayed in the dialog. If you select "Total," the "Total" graph appears. Otherwise, the information about multiple units is displayed in the same graph window. If "R/W/P" or "R/W" is selected, "Total" must be selected.
From the device tree view in the Performance Management window, select the number of the disk whose performance you want to display, right-click to display a popup menu, and select [Show Performance Graph].
You can select multiple disks. To select multiple disks, click multiple disks while holding down the Ctrl or Shift key, right-click and select [Show Performance Graph].
The dialog shown below appears. In the dialog, select the graph window to be displayed.
|
Time Axis |
Select the time interval for a graph that you want to display. Select one hour, one day, or one week. Refer to "7.1.2 Performance Graph Window Types" for details. |
|
Date Specification |
Specify the date and time to be displayed in the center of the graph. The current time is displayed. You may select the date and time of a graph that you want to display. A period of up to 7 days can be specified. |
If multiple logical units are specified for displaying a graph, "Open Window for Every Disk" is displayed in the dialog. If you select it, one graph window opens for each disk. Otherwise, the information about multiple disks is displayed in the same graph window.
To display the performance graph, select the module (CM, CA, CMPort, DA) from the performance management window and use a right mouse click to display the pop up menu, and then click on [performance graph display]. Multiple modules can be selected by holding down the [Ctrl] key or the [Shift] key while clicking on the modules. When DA is selected the DA Performance Graph dialog shown below is displayed and when CA or CM Port is selected their respective performance graph dialogs will display.
From the performance graph dialog, select the options for the particular graph you wish to be displayed in the graph window.
|
Time Axis |
Select the time interval for a graph that you want to display. Select one hour, one day, or one week. |
|
Date Specification |
Specify the date and time to be displayed in the center of the graph. The current time is displayed. You may select the date and time of a graph that you want to display. A period of up to 7 days can be specified |
|
CPU |
Displays the CPU usage (%) of DA or CA. |
|
IOPS |
Displays the number of I/O issued per second of DA, CA port, or CM Port. |
|
Throughput |
Displays the data transfer volume (MB/S) of DA, CA port, or CM Port. |
CA's on ETERNUS8000 and ETERNUS4000 (except for M80 and 100) do not use CPU resources; therefore CPU will not display on CA performance graphs.
When CM is selected the following CM Performance Graph will display.
A chart window can be selected on this dialog.
|
Time Axis |
Select the time interval for a graph that you want to display. Select one hour, one day, or one week. Refer to "7.1.2 Performance Graph Window Types" for details. |
|
|
Date Specification |
Specify the date and time to be displayed in the center of the graph. The current time is displayed. You may select the date and time of a graph that you want to display. A period of up to 7 days can be specified. |
|
|
Graph |
Load |
Displays the CPU usage (%) of CM module. |
|
Copy Residual Quantity |
Displays the remaining copy volume (GB) of advanced copy (EC/OPC). When both EC and OPC are operating, a total of the remaining copy volumes of EC and OPC is displayed. |
|
For the ETERNUS3000 (except M50) and GR (ETERNUS GR720 and higher), the CA Performance Graph dialog box does not display Copy Residual Quantity data.
Selecting "Open Window for Every Port" and "Open Window for Every CM" on the dialog when multiple items are selected displays chart windows for respective modules.
If the amount of performance data is large (in particular, when the ETERNUS disk array device RAIDGroup or multiple selections are chosen), or if load on a LAN is heavy, a long time may be required to display a graph after the [Previous Hour] or [Next Hour] button is clicked. In such cases, right-click the mouse on the graph window to open a popup menu. The popup menu has a command for opening a graph window from which the time range of a graph can be changed. Select the command, and open the One-day Graph window from the graph window so that hour-by-hour information is displayed, move the cursor in the One-day Graph window to the time that you want to check, right-click to display a popup menu, and select [One-hour Graph Window] for a smooth transition to a graph centered on this time.
To display the maximum value graph, click the [Peak] button in the One-day Graph window, or One-week Graph window. You can then move the cursor to the time of the maximum value and right-click to display a popup menu, enabling a smooth transition to a graph centered on this time of the maximum value in the same way as described above.
Refer to "B.10.5 Graph window functions".
If an I/O delay from the server node to a storage system occurs, the user can check for the cause in the storage system by using the methods described below. These are only examples, so all causes of I/O delays cannot be determined by use of these methods.
Identify the time when the I/O processing delay occurred and the access path where the delay occurred.
Use this product to check the AffinityGroup number and LUN number of the ETERNUS disk array defined in the target access path.
Using performance management, display and check the target LUN performance values.
If a response of the LUN unit takes a long time, check RAID Group performance. If a response of RAID Group also takes a long time, find another Logical Volume belonging to RAID Group, and find the LUNs to which the Logical Volume is allocated. Check the I/O statuses of these LUNs, and check for a heavy load on RAID Group. If there is a heavy load, move the appropriate LUN to another RAID Group, or take other appropriate action.
Click the target device on the GUI window. Select [Device]-[Performance management(S)] from the menu, or right-click and select [Performance management] from the resulting popup menu. Then, select [Stop] in the window for setting the monitoring status.
Device configuration information is independently maintained in the performance management functionality.
To change the device configuration, update the device configuration information that is maintained by the performance management functionality according to the procedure shown below. Also perform the update if the configuration for a device used to execute performance monitoring and threshold monitoring has been changed.
If the configuration for a device used to execute performance monitoring and threshold monitoring has been changed, the configuration information before the update is used for performance monitoring and threshold monitoring. Performance information and threshold monitoring, shown in the procedure below, cannot be guaranteed prior to the configuration information update.
<Configuration information update procedure>
Record the performance monitoring settings contents (if performance monitoring is used)
<Recorded settings contents>
Interval before obtaining performance information (in seconds)
Performance monitoring targets (Minimum LUN_V, Maximum LUN_V)
Record the threshold monitoring settings contents (if threshold monitoring is used)
<Recorded settings contents>
Threshold monitoring time settings
Threshold monitoring time (start time, stop time)
Alarm display time (start time, stop time)
Alarm display frequency
Threshold monitoring settings
Target
Threshold
Threshold monitoring Interval
Alarm tolerance level
Alarm tolerance time
Rearm
Stop threshold monitoring (if threshold monitoring is used)
Refer to "7.3.7 Instruction for stopping threshold monitoring".
Stop performance monitoring (if performance monitoring is used)
Refer to "7.2.10 Instruction for stopping performance management".
The composition of the device is changed.
In the menu bar of the Performance Management window, click [Device] > [Create Device Configuration].
Start performance monitoring based on the settings contents recorded in 1. (if performance monitoring is used).
Refer to "7.2.2 Instruction for performance management" and "7.2.3 Setting monitoring intervals".
Start threshold monitoring based on the settings contents recorded in 2. (if threshold monitoring is used).
Refer to "7.3.3 Setting the threshold monitoring hours" and "7.3.4 Setting the threshold monitoring information".
Performance data is saved in CSV files in the following directory of the administrative server:
[Solaris OS version of Manager] /var/opt/FJSVssmgr/current/perf/
[Linux version of Manager] /var/opt/FJSVssmgr/current/perf/
[Windows version of Manager] administrarive-server-work-directory\Manager\var\opt\FJSVssmgr\current\perf
You can save these files by saving the entire directory as necessary, and you can display old information as necessary by recovering it in the same format.
However, the automatic deletion functionality operates in the performance data. When restoring, execute it after confirming days of the data retention duration. For the data retention duration, refer to "D.4 perf.conf Parameter".
Example: (Solaris OS)
Backup
# cd /var/opt/FJSVssmgr/current/perf/
# tar -hcf - csv |compress -c > csv.backup.tar.Z
Restoration
# cd /var/opt/FJSVssmgr/current/perf/
# uncompress -c /var/opt/FJSVssmgr/current/perf /csv.backup.tar.Z | tar -xvf -
When a user uses the Performance Management window to issue an instruction for threshold monitoring of the devices subject to performance management, the performance management unit of this software product periodically issues SNMP Traps through the LAN to the devices to obtain device performance information. The threshold-monitoring unit then sequentially analyzes the performance information.
If a problem is detected from the performance information, it is displayed as an alarm in the event log in the SAN Management window and displayed in the Threshold Monitoring Alarm Notification Log window of the Performance Management window.
When a problem is displayed as an alarm in the event log, the event level is shown as [Warning].
For threshold monitoring, users must prepare disk space on the administrative server to save condition reports of the threshold monitoring alarm notification log. About 4 MB is required. Make sure that the server has sufficient disk space. This software product has a functionality for deleting condition report data whose set retention duration days have passed. Data stored for 366 days or more is automatically deleted. Change this retention duration setting as required. For details, see Alarm Delete Setting in the "B.10.6 Threshold monitoring dialog functionality".
Select the device name tree node from the GUI window Performance Management window tree, and select [Threshold Monitoring] from the menu. Then, a variety of threshold monitoring setup menus appear. To use the menus, however, performance information of the device must have already been obtained by performance management.
Select [Monitoring Enable/Disable(E)]. This enables threshold monitoring, and you can set up different kinds of threshold monitoring.
To set a time period for threshold monitoring, select [Monitoring Time Setting]. If no time period is set, thresholds are monitored and alarms are reported for all time periods. Large volumes of threshold monitoring alarm logs may be reported depending on threshold settings. Users are recommended to set a time period if performance is a concern in a system environment where load varies considerably depending on how to use a target device.
Next, select [Threshold Setting/Start Monitoring/Stop Monitoring(S)], define threshold setting information of the target device, and issue an instruction to start monitoring. Threshold monitoring then starts. Incidentally, since the threshold monitoring unit is started as a daemon of the administrative server along with the performance management unit, the threshold monitoring unit continues threshold monitoring while the administrative server is active, even if no GUI window is displayed. Moreover, refer to "B.10.6 Threshold monitoring dialog functionality" for the setting of threshold setting information.
To display threshold monitoring alarm logs, open the Performance Management window, select [Threshold monitoring] from the menu bar, and select [Thresholds Alarm Log] from the displayed list. The displayed list is a list of logs of alarms detected by threshold monitoring. To open the Performance Management window, select [File(F)]-[Performance Management Window(S)] from the GUI menu.
Details of the list displayed by [Thresholds Alarm Log] are displayed. Users can determine the appropriate actions and guidelines to take for different threshold monitoring alarms in the displayed report logs. To display the details, move the cursor to the report line of the threshold monitoring alarm log to be referred to, and double-click on the line.
From the Performance Management window menu in the GUI window, select [Threshold Monitoring(T)]-[Threshold Setting/Start Monitoring/Stop Monitoring(S)]. To end threshold monitoring, click the [Stop] button in the window displayed for setting a threshold.
Storage thresholds
Standard storage thresholds are listed below.
|
|
Online response-oriented system |
Batch throughput-oriented system |
|---|---|---|
|
LogicalVolume Response |
30 ms or less |
- |
|
RAIDGroup Busy Rate |
60% or less |
80% or less |
|
CM Busy Rate |
80% or less |
90% or less |
For a response-oriented system such as for online applications, implementing LogicalVolume responses within 30 ms is a standard for stress-free storage operation. To implement responses within 30 ms, suppress the RAIDGroup busy rate to 60% or less and the CM busy rate to 80% or less.
In a throughput-oriented system such as for batch applications, LogicalVolume responses are extended to a few milliseconds because sequential access increases the cache hit ratios. However, the cache hit ratios are greatly affected by application access and the values change a great deal. As a result, responses may vary from a few milliseconds to 50 ms or more. Thus, for batch applications, there is no standard threshold for LogicalVolume responses.
To improve throughputs for batch applications, users must optimize the use of storage resources. Note, however, that performance may deteriorate rapidly if the above threshold is exceeded. For this reason, make it a standard to suppress the RAIDGroup busy rate to 80% or less and the CM busy rate to 90% or less.
During hours in which advanced copy is processing, advanced copy processing itself increases the CM busy rate.
For this case, set thresholds in consideration of execution of advanced copy.
Thresholds of switch ports
The threshold and lower limit value vary depending on the type of applicable switch (1 Gbps or 2 Gbps). When the switch type is 1 Gbps, the maximum value (100% use rate) is 100 MBps. When the switch type is 2 Gbps, the maximum value is 200 MBps. For the threshold, specify the allowable utilization (%) corresponding to the maximum value.
For instance, when 90% is specified for the threshold of a 2 Gbps type switch, the threshold of the throughput is:
200 MBps x 90% = 180 MBps (total of reception and transmission)
An alarm is given when the throughput reaches 180 MBps.
Switch port threshold monitoring is effective when there is a difference in the numbers of paths between the server and storage.
This section provides an overview of threshold monitoring in the form of key examples to enable users to determine what situations require thresholds and the types of thresholds that should be set for them.
Case 1: Online application system at company A
|
|
Number corresponding to material 1 |
Setting item |
Setting |
|---|---|---|
|
1 |
Threshold Monitoring Time |
8:00-18:00 |
|
2 |
Alarm Display Time |
12:00-15:00 |
|
3 |
Target |
LogicalVolume Response |
|
3 |
Threshold |
30 ms |
|
4 |
Threshold monitoring Interval |
60 minutes |
|
4 |
Alarm Tolerance Level |
Total time: 360 seconds |
|
5 |
Rearm |
10 ms |
|
6 |
Alarm Display Frequency |
Day by day |
Case 2: Online shopping system of company B
|
|
Number corresponding to material 2 |
Setting item |
Setting |
|---|---|---|
|
1 |
Threshold Monitoring Time |
0:00-24:00 |
|
2 |
Alarm Display Time |
0:00-24:00 |
|
3 |
Target |
CM Busy Rate |
|
3 |
Threshold |
60% |
|
4 |
Alarm Tolerance Level |
Continuous time: 300 seconds |
|
5 |
Alarm Display Frequency |
All |
|
Number corresponding to material 2 |
Setting item |
Setting |
|---|---|---|
|
1 |
Threshold Monitoring Time |
0:00-24:00 |
|
2 |
Alarm Display Time |
0:00-24:00 |
|
3 |
Target |
RAIDGroup Busy Rate |
|
3 |
Threshold |
80% |
|
4 |
Alarm Tolerance Level |
Continuous time: 300 seconds |
|
5 |
Alarm Display Frequency |
All |
Case 3: Batch processing with multiple database servers (cluster system) of company C
|
|
Number corresponding to material 3 |
Setting item |
Setting |
|---|---|---|
|
1 |
Threshold Monitoring Time |
0:00-24:00 |
|
2 |
Alarm Display Time |
20:00-23:00 |
|
3 |
Target |
Port Throughput |
|
3 |
Threshold |
80% |
|
4 |
Alarm Tolerance Level |
Continuous time: 1,800 seconds |
|
5 |
Alarm Display Frequency |
Every monitoring time |
|
Report detail: |
|
High load state detected |
An alarm log indicating a CM load error is generated during the same time zone. If the CM in charge of the LogicalVolume in which a response delay was detected is in the high load state, a response delay due to a CM bottleneck is assumed. Refer to the guidelines for corrective measures for alarms for the relevant CM. |
|
Monitoring |
The CM is monitoring for alarm detection because the threshold has been exceeded several times although no events have been detected as an alarm. |
|
Not detected |
[When the CM busy rate is defined as a monitoring target] |
|
[When the CM busy rate is not defined as a monitoring target] |
|
High load state detected |
An alarm log indicating a RAIDGroup load error is generated during the same time zone. A response delay due to bottlenecks of disks configuring a RAID is assumed. Refer to the guidelines for RAIDGroup corrective measures for alarms for the relevant RAIDGroup. |
|
Monitoring |
The CM is monitoring for alarm detection because the threshold has been exceeded several times although no events have been detected as an alarm. |
|
Not detected |
[When the RAIDGroup busy rate is defined as a monitoring target] |
|
[When the RAIDGroup busy rate is not defined as a monitoring target] |
|
Report detail: |
|
Report detail: |
|
High load state detected |
An alarm log indicating a load error in the relevant CM is generated during the same time zone. |
|
Monitoring |
The CM is monitoring for alarm detection because the threshold has been exceeded several times although no events have been detected as an alarm. |
|
Not detected |
The relevant CM did not cause a bottleneck during the same time zone. |
CM is put in high load state when a transaction is in contention with advanced copy.
In this case, review the operation mode so that advanced copy is executed in a time slot in which a transaction load is relatively small. Alternatively, if the same CM controls both the copy source and target volumes (RAIDGroups), use separate CMs to control the source and target volumes.
|
Report detail: |
The following items can be set up in the set up file perf.conf for performance management.
The number of days to retain performance data in the performance management
The number of generations of log files (perflog.*)
Refer to "Appendix D.4 perf.conf parameter" for the settings.
|
Contents
Index
|