
| ETERNUS SF Storage Cruiser User's Guide 13.2 - Solaris (TM) Operating System / Linux / Microsoft(R) Windows(R) - |
Contents
Index
 
|
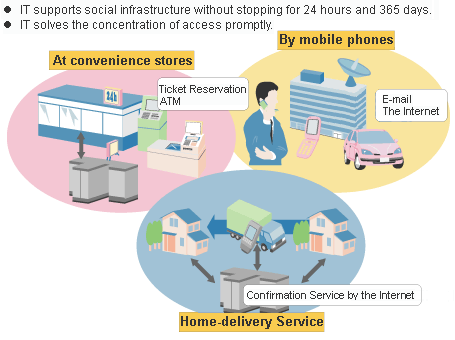
Social systems utilizing IT have been deployed in various situations of our lives. For example, those situations are ticket booking at convenience stores, cash dispensing on ATMs, e-mailing on mobile phones, photo mailing, internet connection, parcel delivery confirmation on the Internet and so on. The 24-hour and 365-day running service that can handle explosive concentrated access is required for these social systems.

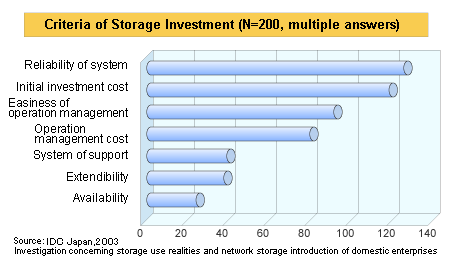
IT has permeated all over our lives, storage data volume increases and more management efforts are likely required. In addition, immediate recovery is required if any failure should occur because important business data is stored in the storage and therefore continuous data access is mandatory. These requirements are exemplified in questionnaire responses as shown in the following chart that many storage investors attach importance to reliability of the administrative and system as criterion for their investment.

Under these circumstances, network storages, such as a SAN and a NAS that give storages independence from server nodes and consolidate data distributed on several server nodes have become to be deployed more and more, as an alternate to a direct attached storage (DAS). With DASs, storage management is required on each server node, and as a result, unused areas are often found on many storage devices. By contrast, consolidating storage devices enables you to reduce administrative costs through centralized management and promotes more effective use of storage capacity. For this reason, the network storage such as a SAN should be a propulsion method that optimizes an entire system from the aspect of storages.
However, as storage devices and servers increase, and the SAN configuration becomes more complex, higher level know-how for designing optimal configuration concerning reliability and performance is required. Also it is more difficult to pinpoint a failed part and to figure out which data in which operation is affected by that error. This implies that the correlation between storages and applications can now hardly be managed manually because of the complex coupling structure of server nodes and storage devices. In other words, a traditional management method is almost impossible to be extended in order to maintain a certain service level for the system.
This software product stands behind the stable operation of a multi-vendor storage system environment such as a SAN, a DAS, and a NAS using the configuration that provide integrated management of storage-related resources and functions of connection, fault, and performance management.
This function displays the status of each device in a current entire storage system and the status of physical connection between devices graphically on the GUI. You can drill down from an icon of each device to the detail window to get detail information which part of the device (for example, a Fibre Channel switch port) is connected to which part.
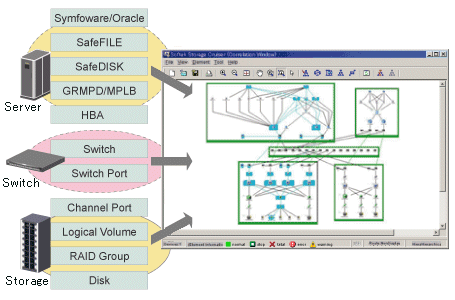
This function not only manages detail configuration within the storage devices but also automatically obtains the physical paths from disks, file systems of the related server nodes, multi paths, mirrored disks, and database configuration information and displays information correlating these data on a single window.
It used to be very hard to recognize the correlation between entities because those entities were supported by their own management tools and were displayed in various formats respectively. In this software product, the correlation of entities can be displayed in a common display format on a single window, and consequently the entire configuration can simply be grasped and an error can be detected if any configuration error should exist. Additionally, such configuration information can be saved in a file, and the configuration can be viewed off-line and compared to the previous one.

Access path display
This function displays the actual access path from a database used by an application to a physical disk and the connection relation on a window. For example, it is useful in the following situations:
When a failure occurs on a part or parts must be replaced, which data and operation it affects can be recognized immediately.
When performance delay occurs on some volume, which data and operation it affects can be recognized immediately with the threshold monitoring function as storage performance. It is also simplified to review the storage system tuning.
Even if a business is delayed, shorter time is consumed to solve the problem because the correlated storage entities can be recognized immediately.
Status and detail information of each entity
Properties are retained for each component and history of events such as failures managed, for example, by the version number, re-edition date, and device of that component can also be viewed.
Failures that occur on devices are properly displayed in an understandable way. In addition, the detailed display on the Correlation window enables you to pinpoint the cause by part. The path display provides detailed information about the areas affected by the failed part allowing for fast and accurate recovery.
Error information can be automatically reported to Systemwalker, integrated administrative software, and other venders' Management Software, and centralized management of the system becomes available.
Performance information of managed devices can be managed and displayed. Performance information of devices are stored on the administrative server, past performance information can be accessed as well as real-time performance information. Additionally, because performance information can be viewed in a graphic format, you can simply see the picture of the performance statuses and load statuses of devices.
In addition, threshold values can be set on devices so that alarms are reported when those threshold values are exceeded. The bottleneck causes and locations can be identified, and as a result, the configuration of devices is improved and the operation in the optimal environment is delivered.
This software provides the following functions for storage systems:
This view, the core component of this product software, is used to manage an entire device system that can be accessed with a login account.
The icon for each category (server/storage/SAN) is displayed in the map area.
When a category (server/storage/SAN) is selected, the domains or SAN device types registered in that category are map-viewed.
When the SAN category is selected, all of the devices that can be accessed with the login account are reflected in the tree.
This view manages the devices (hosts or storage) that are registered in each domain and their related devices.
One device is map-viewed with one icon.
Server domain is a logical unit for server node management.
Storage domain is a logical unit for storage management.
Base domain means the logical unit of the physical resource of server or storage in server domain or storage domain, which managed by this software product.
When a device type of the SAN category is selected, the devices of that device type are map-viewed.
This view is used to display only the devices and Fibre Channel switch that are physically or logically connected to a device or to manage access paths. (The access paths are managed only when a server node or storage is selected.)
To display the Side view, select and double-click a device icon in the Domain view.
This function manages and sets access paths automatically by performing integrated management of security functions provided from the server node side, Fibre Channel switch side, and storage side.
An access path can be automatically recognized and displayed from the binding/zoning information that has already been set in a device. Because the access path is collectively managed, based on the security information for each device, even if the physical Fibre Channel cable, a SAN route that forms the access path, is disconnected, the access path can be displayed as an error.
For access paths managed by this software, the configuration definition of a device can be changed manually as well as automatically from this software. In such cases, it can check whether the manual configuration changes were performed correctly.
This window is used to show devices and the Fibre Channel switch that are logically connected to each device. Unlike the Side view, the window can display logical elements of each device in detail.
ETERNUS disk array device: a disk, RAID group, volume, Host Affinity, port, CM, CA, DA
Fibre Channel switch: a port
Server Node: Definitions related to host for a port, HBA, multi-path instance, mirror disk instance, file system, and database
These elements are graphically displayed.
If an element has a state, the state can be displayed. Therefore, the location of a problem can be identified immediately.
In addition, clicking an element displays related elements explicitly. Therefore, affected elements can easily be identified in the event of a problem.
The Correlation window can be launched/displayed in one of the following three manners.
Click [File(F)] on the menu bar to display the Correlation window. Then, select a device icon in the Domain view or SAN view and drop it onto the Correlation window. The details of the device are then displayed in the Correlation window.
When the icon of a device is double-clicked in the Domain view or SAN view, its side window is displayed. In the Side view, the frame of the device that is selected in the Domain view or SAN view is displayed in black. If the device with the black frame is double-clicked, the Correlation window opens to display details of that device.
Click a device icon in the Domain view or SAN view to display a pop-up menu. When [Send] and [Correlation Window] are selected, the Correlation window opens to display details of that device.

Devices subject to storage management must be registered with this software product. To register a device, the IP address of the device is required. In addition, a user ID and password for management are required for the Fibre Channel switch and storage.
The fault management function of this software product has the four features described below.
This software product processes an SNMP Trap from a device and monitoring information from Agent, properly decodes them, and displays them as an asynchronous event.
Since the displayed contents of the event are more detailed and easier to understand than decodes generated by a normal SNMP MIB compiler, they support smooth operation.
The display format (show, hide, display color) for events can be customized in detail by using an XML file. Therefore, operation can be made suitable for the environment used. In addition, fault management of a device not supported by this software product is dynamically enabled by adding and editing the XML file.
Since events can be linked to the Systemwalker Centric Manager linkage and Shell files that can be edited as desired by users, operation can be made suitable for the environment used.
For information on events, see "D.6 SNMP Trap XML Definition File".
The device polling function is a function for this software product to observe regularly the state of all devices connected with LAN by using SNMP, ping or unique protocol. When the SNMP Trap from the device cannot be received, the change in the state of the device can be detected and the network error between each device and the administrative server of this software product can be detected by this function.
The state change is reflected in the event log and the icon color.
This function is effective to the manual embedded device.
The icon color of a device changes depending on the current status of the device by acquiring latest information.
If a problem occurs, the color of the corresponding category icon or device icon becomes red or yellow. The component with the fault can be identified by placing the device icon appropriately in the Correlation window. (For some faults, however, the icon color of the devices with the faults is not changed, and only events are displayed.)
Revolving light icon lights in red, yellow or green when there is a change in the state of the device.
Click the revolving light icon and select [OK] of shown dialog. Then, latest information is obtained and the icon color is changed in accordance with the current status of the device (Processing same as above-mentioned "Fault monitoring by checking the current status of devices" is done.)
For information about revolving light icon, see "6.5 Revolving Light Icon".
When fault monitoring is begun, fault monitoring is continued only by starting the manager regardless of the operation of the client.

Fault monitoring is done by way of LAN. Fault monitoring can be done only to the device that LAN can connect.
When the performance information reservation command is issued from the Main View, Domain view or SAN view for devices from which performance information is to be obtained, the performance management part of this software product uses SNMP to obtain performance information from the devices and saves the obtained information on the management server. The information can be displayed and managed in the Performance Management window. To manage the performance information of a device, display the Performance Management window from [File], and then drag the device icon from the Domain view or SAN view and drop it in the window.
Performance control functionality supports the fiber channel switch and ETERNUS disk array device. This function can be used to obtain the detailed operational status and load status of a device.
In addition, a threshold can be set for particular information. The function can detect a potential bottleneck and be used to address the problem.
The performance information can be referenced using Systemwalker Service Quality Coordinator. For details, refer to the Systemwalker Service Quality Coordinator manual.
For details about supported devices, refer to "1.3.5 Support levels".
The information managed by the performance control is different for the fibre channel switch and ETERNUS disk array.
Fibre Channel switch
| Performance information (Unit) | Fibre Channel switch | |
| Port | Transfer rates of send/receive data (MB/S) | supported |
| Number of CRC errors | supported |
ETERNUS disk array device
| Performance information (Unit) | ETERNUS8000, ETERNUS4000 (Except ETERNUS4000 model 80/100) |
ETERNUS6000 | ETERNUS4000 (M80/100), ETERNUS3000 (Except model 50), ETERNUS GR series (ETERNUS GR720 or higher) |
ETERNUS2000 | |
| LUN Logical Volume RAID Group |
Read count and write count (IOPS / IO per second) | supported | supported | supported | supported |
| Read and write data transfer rate (MB/S) |
supported | supported | supported | supported | |
| Response time for Read and Write (msec) | supported | supported | supported | supported | |
| Read, pre-fetch, and write cache hit rate (%) | supported | supported | supported | supported | |
| Disk drive | Disk busy rate (%) | supported | supported | supported | supported |
| CM | Load (CPU usage) rate (%) | supported | supported | supported | supported |
| Copy remaining amount (GB) | supported | supported | not supported | supported | |
| CA | load factor (CPU usage rate) (%) | not supported | supported | not supported | not supported |
| Read count and write count (IOPS / IO per second) | supported | supported | not supported | not supported | |
| Read and write data transfer rate (MB/S) | supported | supported | not supported | not supported | |
| CM Port | Read count and write count (IOPS / IO per second) | not supported | not supported | not supported | supported |
| Read and write data transfer rate (MB/S) | not supported | not supported | not supported | supported | |
| DA | load factor (CPU usage rate) (%) | not supported | supported | not supported | not supported |
| Read count and write count (IOPS / IO per second) | not supported | supported | not supported | not supported | |
| Read and write data transfer rate (MB/S) | not supported | supported | not supported | not supported |

Do not execute performance monitoring for a single device from more than one administrative server(*) at the same time.
* The Softek Storage Cruiser administrative servers, the ETERNUS SF Storage Cruiser administrative servers or the Systemwalker Resource Coordinator administrative servers.
When RAID Consolidation is being performed in ETERNUS6000, the RAIDGroup response time will not be displayed.
LogicalVolume(LUN) and RAIDGroup performance information including LogicalVolume,created by LUN Concatenation in ETERNUS disk array device, will not be displayed.
ETERNUS disk array device main volume and performance information for MVV and SDV are not supported. RAIDGroup performance information including SDV cannot be guaranteed.
ETERNUS6000CA performance information displays FC-CA port or FC-RA port performance information. Performance information during the execution of REC and ROPC, will be displayed as Write performance information, even if FC-RA port is set up on the Initiator or the Target.
Information for threshold monitoring differs between the fibre channel switch and the ETERNUS disk array device.
Fibre Channel switch
Port throughput (%)
* A port throughput value (MB/s) is monitored as the percentage (%) of an allowable tolerance to a maximum transfer capability (MB/s).
ETERNUS disk array device
Response time (msec) of LUN (OLU)
Average use (busy) rate (%) of RAIDGroup (RLU, LUN_R)
CM load (CPU usage) rate (%)
Virtual Storage Conductor (hereinafter called VSC) is a component of ESC that provides the virtual storage function on a Fibre Channel switch in the network layer, without dependence on the storage hardware's physical attributes.
Virtual disk creation
VSC manages the virtual disk in storage pool that allows you to create a volume of a size independent of the storage logical unit (Logical Volume) size.
Server-free data service
VSC provides the server-free data service function, which copies data using the resources of the virtualization switch without using the resources (CPU and memory) of the job server.

For detail information about VSC, please refer to "ETERNUS SF Storage Cruiser User's Guide for Virtual Storage Conductor".
Note: This function is not supported in all regions. Please check with your sales representative to see if this function is supported in your area.
The scope of the storage management functions of this software product that can be used varies with the storage device model being used. For this software product, the scope of available functions is represented as support levels, which are used as settings of the fault monitoring function and for other purposes. The table below lists the support levels that can be selected.
|
Support level |
Typical device name |
Device detection |
Fault management |
Management window linkage |
FC connection line drawing |
Detail display of correlation management (*1) |
Performance management |
||
|---|---|---|---|---|---|---|---|---|---|
|
SNMP Trap monitoring |
Device polling monitoring (*2) |
Acquisition of device state |
|||||||
|
A |
ETERNUS8000 ETERNUS2000 |
Automatic (*3) |
|
|
|
|
Automatic |
|
|
|
B |
Solaris OS, Windows, Linux, HP-UX server node on which ESC or SSC Agent is already installed McDATA FibreChannel switch (*6) |
Automatic (*3) |
|
|
|
|
Automatic |
|
- |
|
E |
ETERNUS SX300, ETERNUS SX300S |
Manual |
|
|
- |
Manual setting |
Manual |
|
- |
|
I |
Other devices that are manually embedded |
Manual |
- (*4) |
- (*5) |
- |
Manual setting |
Manual |
|
- |
|
J |
Tape encryption device |
Manual |
|
|
- |
Manual setting |
Manual |
|
- |
*1 [ ] indicates that detail information on device internal elements can be displayed. [
 ] indicates that information on the device and FC port can be displayed.
*2 Fibre Channel Switch blade devices using SNMP can be used with ETERNUS8000, ETERNUS6000, ETERNUS4000, ETERNUS3000, ETERNUS2000, SN200and PRIMEGRY BX600 Fibre Channel switch blade. A server node with Agent already installed uses a unique protocol. The other devices use ping for monitoring.
*3 The "Detect device in subnet" function is not supported by the devices below. Use the "Detect by IP address" function to specify an IP address for each device. For server nodes, use the [Register server] function.
Firmwear version v4.0 or above ETERNUS SN200(Brocade)
Solaris OS, Windows, Linux, HP-UX server node on which ESC or SSC Agent is already installed
ETERNUS LT270,LT250 or LT160
ETERNUS VS900
ETERNUS VD800
PRIMERGY BX600 Fibre Channel switch blade
*4 For devices supporting SNMP Traps, this function is enabled by creating a SNMP Trap XML definition file.
*5 For devices supporting LAN, ping monitoring is enabled by specifying an IP address at manual embedding.
*6 SNMP Trap transmission must be set for each device. (This product does not automatically make said setting.)
*7 Since no vendor-specific trap is available, only traps common to devices can be displayed.
*8 In the disk array device of ETERNUS VD800, access paths to the FC-CA port to be connected to a host server cannot be set or deleted. Logical information of the FC-CA port to be connected to a host server is not displayed in the related management information. Use VDSC (Virtual Disk Service Console) to set the access paths or check the display of logical information.
*9 ETERNUS SX300, ETERNUS SX300S do not support device-polling monitoring.
*10. The performance information can be referenced using Systemwalker Service Quality Coordinator. However, the ETERNUS SN200 MDS series Fibre Channel switch is not supported.
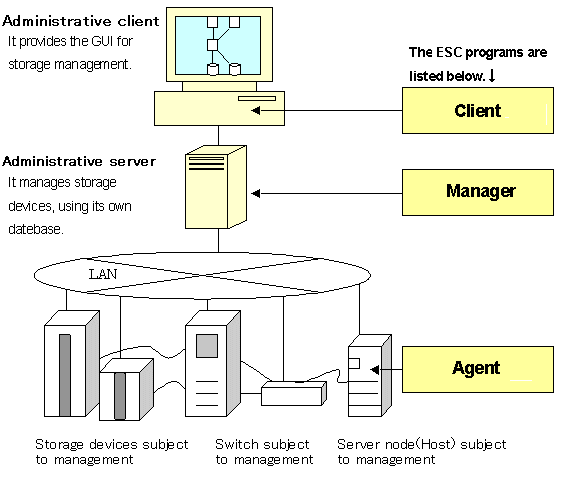
ESC consists of the following programs: ESC Manager, ESC Agent, and ESC Client.
This user's guide refers to devices on which respective programs were installed as the administrative server, the server node, and the administrative client. These programs can be installed on a single device and operated as well. In that manner, there is no restriction on the order of installation of these programs.
ESC Manager (administrative server) is the central management part of ESC that obtains and sets information about devices involved in the storage system on the LAN. Important data among those used for controls are stored in the database.
ESC Agent (server node) controls information about home software such as an HBA and a multipath driver on the server node using the storage and communicates with ESC Manager. When there are several server nodes, it must be installed on each of them.
ESC Client functions as the ESC GUI (screen control part) used to connect to ESC Manager. Multiple clients can be connected to the same ESC machine at the same time.
[Figure 1.1 ESC Configuration]

For the following function, user interface of ESC and SSC are different.
|
Function |
SSC |
ESC |
|
Login account |
The default login account is as follows:
|
There is no default login account. Login account is set when install ESC manager. |
|
Exit client program |
[File(F)]-[Exit(X)] client application will finish. |
[File(F)]-[Log out(G)] log out and return to the login screen. |
For the following function that supported by SSC, is not supported by ESC.
Page setting ([File(F)]-[Page setup(F)]) for Resource View ("Resource View" is defined in 6.1 Resource View)
Print ([File(F)]-[Print(P)]) for Resource View ("Resource View" is defined in 6.1 Resource View)
Access path diagnose ([Operation(C)]-[Access Path(P)]-[Diagnose(I)])
Change screen color([View(V)]-[Option(O)]-[Change Screen Color(C)])
Dynamically display real-time performance graph on the performance windows (<Dynamic ON> button/ <Dynamic OFF> button)
Login account's single sign on with Systemwalker Centric Manager
Command "setswnode" for changing the manager's IP address is unnecessary for ESC
Contents
Index
 
|