In the Status Window, the number of PCs corresponding to the following auditing items is displayed in graph:
PCs that exported files
The number of PCs that have executed file export is displayed. For the file export log/file operation log, aggregation is performed after the conditions such as aggregation period, drive type of external memory media and folder path of export source have been added.
PCs used out of working time
The number of PCs that have logged on/logged off out of the time frame for PC operation defined by administrator is displayed. For logon/logoff log, aggregation is performed after the conditions such as aggregation period, day of a week and time frame have been added.
PCs that performed suspicious access
The number of PCs that have performed suspicious access is displayed. When the PC was started in safe mode and domain is used, aggregation is performed for logon/logoff logs after the conditions such as login as local user and login with administrator authority have been added.
PCs not connected for a long period
The number of PCs that have not been connected or used for a long time is displayed. For policy distribution status of Systemwalker Desktop Keeper, aggregation is performed after the condition of time period in which the PC is not connected has been added.
Smart devices not connected for a long period
Number of smart devices that have not been connected for a long period or in which the client feature might have been uninstalled. The period in which the device has not been connected is added as a condition of aggregation for policy distribution status of Systemwalker Desktop Keeper.
PCs that blocked the use of prohibited device
The number of PCs on which the use of prohibited device has been blocked is displayed.
For the log of violation to the category of device configuration change log, aggregation is performed after the condition of aggregation period has been added.
PCs that blocked the use of prohibited account group
The number of PCs on which the logon with the User ID that belongs to a prohibited account group has been blocked is displayed.
For logon prohibition log (*), aggregation is performed after the condition of aggregation period has been added.
* The user of the User ID that belongs to the group specified in the "Logon Prohibition" policy will be recorded as a violation.
Devices that blocked the use of prohibited application
The number of devices (PCs and smart devices) on which the startup of prohibited application has been blocked is displayed.
For application startup prohibition log (*1) and application usage prohibition log (*2), aggregation is performed after the condition of aggregation period has been added.
*1: The startup of an application that is specified in the "Application Startup Prohibition" policy will be recorded as a violation.
*2: The attempt to use applications specified in the application usage prohibition policy will be recorded as a violation.
PCs that blocked prohibited printing
The number of PCs on which the prohibited printing has been blocked is displayed.
For printing prohibition log (*), aggregation is performed after the condition of aggregation period has been added.
*Printing through an application that is not specified as the permitted application in "Printing Prohibition" policy will be recorded as a violation.
PCs that blocked the sending of email with prohibited attachment
The number of PCs on which the transmission of prohibited E-mail file attachment has been blocked is displayed.
For E-mail attachment prohibition log (*), aggregation is performed after the condition of aggregation period has been added.
Only the E-mail sending through SMTP will be the target.
* Sending of an E-mail with the prohibited attachment specified in the "E-mail Sending" policy will be recorded as a violation.
The system administrator can set whether to show/hide each item.
For details on setting these items, refer to "2.7.1 Prepare for Using Status Window".
The confirmation procedure is as follows:
Determine the auditing items in the Status Window.

(1) Title (proportion): This is the title of the auditing item. The scale in () indicates whether the percentage of PCs that become the managed targets are in correspondence.
(2) Correspondent number of PCs: The correspondent number of PCs is displayed. After clicking the number of PC, the CT Operation Log - List of fault PC window is displayed. Refer to "[CT operation log(Operation) - List of fault PC] window" for details.
Status icon: It shows the status of correspondent number of PCs using icons.
![]() : This is displayed when the correspondent number is 0.
: This is displayed when the correspondent number is 0.
![]() : This is displayed when the correspondent number is more than 1.
: This is displayed when the correspondent number is more than 1.
(3) Proportion Bar Chart: This shows the proportion of correspondent number of PCs using a bar chart.
(4) Show Details: Under the bar chart, the number of PCs at each department is shown in tables and pie chart. Refer to "Number of PCs in each department" for details.
Click the Show Details button of the item and the department to which the error PC belongs can be known.
During a log search in Log Viewer, which CT group is more suitable to be a search target can be clarified.

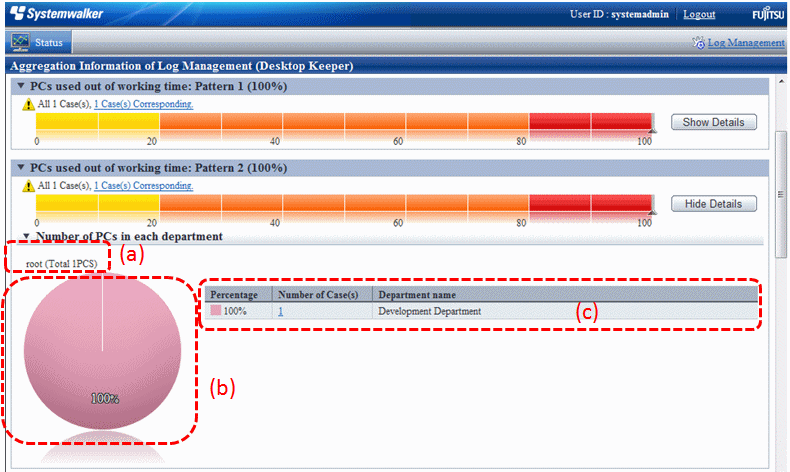
The number of PCs in each department is displayed.
The initial status is that the information of the top management department that manages the login user is displayed.
(a) Target Department: This shows the level of the displayed department. The department selected in Department of Aggregation Target is displayed at the far left.
(b) Pie chart: This shows the number of correspondent PCs of each department and its proportion to the number of all PCs.
(c) Ranking table: This shows the number of correspondent PCs of each department and its proportion to the number of all PCs in sequence.
After clicking the number, List of fault PC will be displayed.
After clicking the department name, the target department, pie chart and ranking table will be changed to the information under the selected department.
Example: When the target department is displayed as "xx headquarter > xx business department"
After clicking the Department name of the ranking table, the display of target department will change to "xx headquarter > xx business department> xx department", while the pie chart and ranking table will be displayed under the unit of the subordinate xx division level.
Click the number of correspondent PC.
List of Fault PC is displayed.

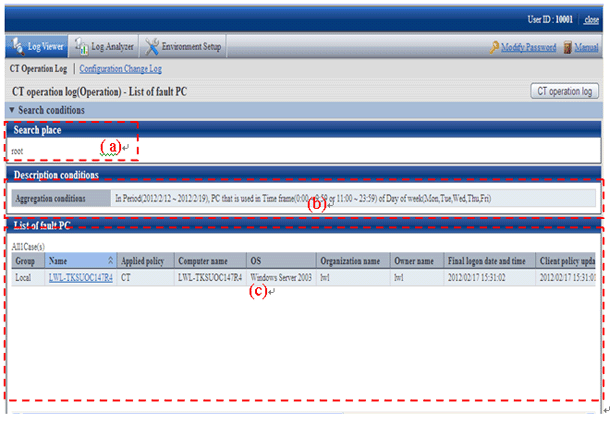
(a) Search place: When the system administrator logs in, it is displayed as root. When the department management logs in, the department (CT group) selected by the department management is displayed.
(b) Description conditions: The conditions when aggregation the title of auditing items and number of correspondent is displayed.
(c) List of fault PC: The list of PC that conforms to the content of Description Conditions is displayed. Item names such as Group and Name will show the information configured in the Display Item Settings window of Log Viewer. For details of the setting method, refer to "Set visible columns in [List of searched CT]".
However, Management Server of item name cannot be set in the Display Item Settings window of Log Viewer. Items must be displayed on the right.
After clicking Name, Log Viewer is started and the search window is displayed. For operation method, refer to "5.2.1 View Logs in the CT Operation Log Window".
From List of fault PC, click the client (CT) name to perform log search.
Log Viewer is started and the search results are displayed. Operations performed in an error PC can be known.
The search result will also contain the content that does not conform to the conditions specified in Environment Settings.