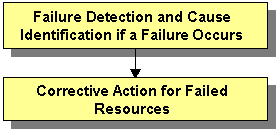
This section describes the corrective actions to take when the resource state became Faulted.

If a failure occurs in a resource, you can use the functions of PRIMECLUSTER and the operating system to detect the failure and identify the faulted resource that caused the failure.
The descriptions given in (a) to (k) below are relevant to the "Failure confirmation features list" given below:
Failure detection
Normally, the RMS main window (b) is used to monitor the cluster applications.
If a failure occurs in a resource or the system
Failover of the userApplication or node panic will occur.
In such a case, you can detect the failure by observing the following conditions:
A pop-up message screen (a) is displayed.
The color of the icons in the RMS main window (b) changes.
A message is output to the msg main window (g), Syslog(j), and the console (k).
If a warning-level failure occurs in the system
If a warning-level failure (for example, insufficient disk space or insufficient swap area) occurs in the system, you can detect the failure by observing the following conditions:
The node icon in the CRM main window (d) changes.
A message is output to Syslog(j) and the console (k).
If RMS fails to start on all the nodes, the userApplication will not start. You can start the userApplication by executing the "clreply" command.
By executing the "clreply" command, you can confirm an operator intervention request to which no response has been entered and start up the userApplication by responding to it. For information on the "clreply" command, see the manual pages.
The operator intervention request message will be output to Syslog(j) and the console (k). By responding to the operator intervention request message, you can start the userApplication.
For further details, see "D.5 Operator Intervention Messages."
Note
If there are multiple operator intervention request messages for which no response has yet been entered, you need to respond to each of them.
In addition, you can use the features described in "Failure confirmation features" to detect the failure.
Cause identification
You can also use the function that detected the failure and the features listed in "Failure confirmation features" below to identify the faulted resource that caused the failure.
Failure confirmation features | Manual reference | |
|---|---|---|
(a) | Message screen | |
(b) | RMS main window | |
(c) | CF main window | |
(d) | CRM main window This screen is useful in detecting hardware resource faults. | |
(e) | "Resource Fault History" screen | |
(f) | Current list of resources in which a failure has occurred | |
(g) | MSG main window To display this screen, select the msg tab in the Cluster Admin screen. | - |
(h) | Application log | |
(i) | switchlog | |
(j) | Syslog | - |
(k) | Console | |
(l) | Machine management GUI | Machine Administration Guide |
(m) | MultiPathDisk view | Multipath Disk Control Load Balance option x.x Guide |
(n) | GDS GUI | PRIMECLUSTER Global Disk Services Configuration and Administration Guide |
Take the following steps for failed resources;
Correct the faulted resource
Correct the problem in the failed resource. For details, see "PRIMECLUSTER Reliant Monitor Services (RMS) Reference Guide."
If an error message of patrol diagnosis is displayed, see "7.4.2 Corrective Action when Patrol Diagnosis Detects a Fault."
"hvdet_sptl" is displayed in the name of the program that outputs the patrol diagnosis message.
Note
If you are using an operation management product other than a PRIMECLUSTER product, you may need to take corrective actions prescribed for that product.
For details, see the manual provided with each operation management product.
[Examples] Machine Administration, MultiPathDisk view, GDS
Recover the cluster application
At the RMS main window, check the state of the cluster application to which the corrected resource is registered. If the cluster application is in the Faulted state, execute the Fault clear operation.
For details on the Fault clear operation, see "7.2.2.4 Bringing Faulted Cluster Application to Online State."