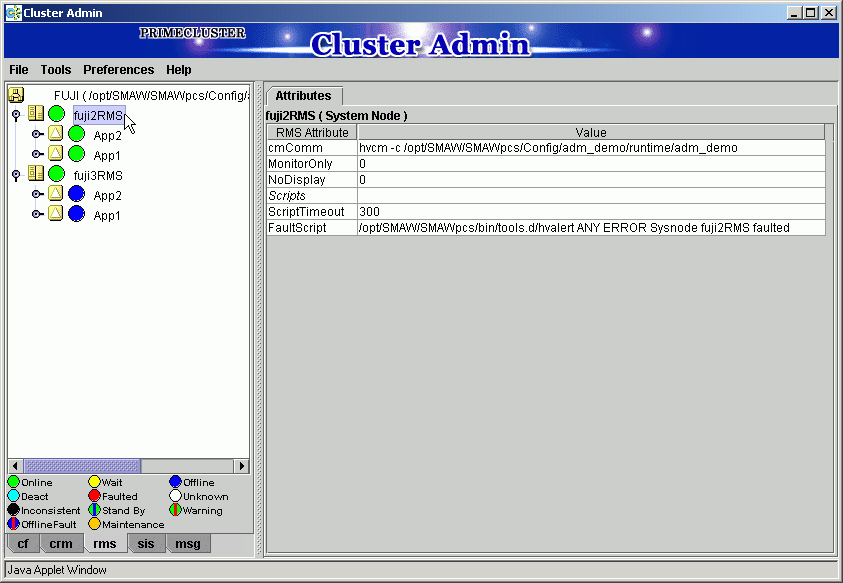
The RMS main window consists of the following elements:
RMS tree
Configuration information or object attributes
Switchlogs and application logs
The RMS tree displays the configuration information of the cluster in a hierarchical format. The tree has the following levels:
Root of the tree - Represents the cluster.
First level - Represents the system nodes in the cluster.
Second level - Represents the userApplication objects running on each of the system nodes.
Third level - Represents the sub-applications (an aggregation of objects if any exist).
Fourth level - Represents the resources required for each of the sub-applications.
If an application has sub-applications, the fourth level represents resources used by that sub-application. If an application does not have sub-applications, then the third level represents all the resources used by userApplication.
Dependency relationships between cluster applications are indicated by controller objects in the RMS tree.
Figure 7.1 RMS main window
Meanings of object icons
Icon | Meaning |
|---|---|
| Represents the cluster. |
| Represents a node. |
| Represents a parent object (cluster application) that has a child object. |
| Represents a child object (cluster application or resource). |
| Represents a leaf object (cluster application or resource). |
| Represents a controller object (cluster application). |
Meanings of state display icons
On the right side of the object icons shown above is displayed a color-coded circle that indicates the state of each object. This section describes the meaning of the colored circles (state display icons).
Information
State display icons are not displayed in cluster icons. Instead, the RMS cluster table can be displayed. For details, see "7.3.3 Concurrent Viewing of Node and Cluster Application States."
State indication of node
The state icons that are displayed in nodes are shown below.
Icon | Icon color | Outline | Details |
|---|---|---|---|
Node |
| Online | Node is enabled and ready for use. |
| Offline | Node is enabled but RMS is disabled. | |
| Faulted | Node is disabled. If the node is shutdown normally, "Shutdown" appears in the SysNode state detailed information (as the value of the StateDetails attribute). If the node is shutdown abnormally, "Killed" appears in the SysNode state detailed information (as the value of the StateDetails attribute). | |
| Wait | Node is undergoing a state transition. |
State indication of other objects
The following state icons are displayed with object icons that fall under parent objects.
Icon | Icon color | Outline | Details |
|---|---|---|---|
|
| Online | Object is enabled and ready for use. |
| Warning | Object has exceeded some warning threshold. | |
| Offline | Object is disabled and should not be used. | |
| Faulted | Object encountered an error condition. | |
| Unknown | Monitoring and control are not being executed for the object. | |
| Wait | Node is undergoing a state transition. | |
| Deact | Node is deactivated because of maintenance, etc. | |
| Inconsistent | Node state is inconsistent. | |
| Stand By | Object is in such a state that it can be quickly brought Online when needed | |
| OfflineFault | Object is Offline, but a fault has occurred before and is not cleared yet. | |
| Maintenance | Object is in maintenance mode. | |
| Maintenance-Online | Object is in maintenance mode and must be Online when exiting maintenance mode. | |
| Maintenance-Offline | Object is in maintenance mode and must be Offline when exiting maintenance mode. | |
| Maintenance-Stand By | Object is in maintenance mode and must be Stand By when exiting maintenance mode. |
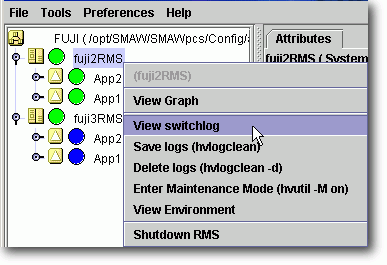
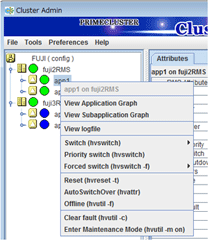
Pop-up menu
If you right-click an object in the RMS tree, a pop-up menu lists the operations for that object. You can also use this menu for monitoring the state.
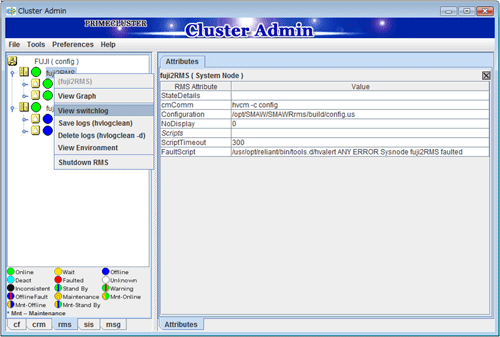
View the configuration information for the individual objects by left-clicking the object in the RMS tree. The properties are displayed in a tabular format on the right-hand side panel of the RMS main window.
Each node has a log file referred to as the switchlog. In this file, switchover requests and node failures are recorded. The switchlog is displayed in a tab on the right-side panel.
Display the application log by right-clicking on an application on the RMS tree and choosing View Application Log.