Use the Analytics Studio to customize the Systemwalker Service Quality Coordinator dashboard templates.
Point
Refer to the Interstage Business Process Manager Analytics Studio Guide for information on how to use the Analytics Studio (for example, customizing charts and views).
Note
The connection information name "01:Summary_ECO" appears as an example in images throughout this chapter. However, the actual names that appear on working windows will depend on the template used in each case.
There are different dashboard templates for the different items that need to be managed.
The items to be monitored will have "Active" applied by default for the information required by the dashboard views mentioned in "4.1.1 Overview" only.
To apply "Active" to items to be monitored that are not default items in template customization, refer to "4.1.3.4 Adding Information to be Monitored to the Dashboard" and apply "Active" to the other items to be monitored, and then perform customization.
Connection information name | Information collected | Remarks |
|---|---|---|
01:Summary_ECO | ServerMonitor | |
ZoneMonitor/ZoneStackMonitor/ZoneStackMonitor(All) | ||
The ECO folder/No data | ||
02:Windows | The Windows folder/Windows reports | |
03:Unix | Solaris & Linux folder/UNIX reports | Records with the Record ID "UX_xxx" are defined from amongst the collected information. |
04:Linux | Solaris & Linux folder/UNIX reports | Records with the Record ID "LX_xxx" are defined from amongst the collected information. |
05:AIX_HP_UX | Solaris & Linux folder/UNIX reports | Records with the Record ID "AX_xxx" and "HP_xxx" are defined from amongst the collected information. |
06:VMware ESX / ESXi) | VMware(Virtual)StackMonitor | |
VMware(Physical)Monitor | ||
The VMware folder/VMware reports | ||
07:Hyper-V | HyperV(Virtual)StackMonitor | |
HyperV(Physical)Monitor | ||
The Hyper-V folder/Hyper-V reports | ||
08:Xen | Xen(Virtual)StackMonitor | |
The Xen folder/Xen reports | ||
24:VMware vCenter | VMware(Cluster)Monitor | |
VMware(ResourcePool)Monitor | ||
The VMware folder/vCenter reports | ||
25:KVM | KVM(Virtual)StackMonitor | |
The KVM folder/KVM reports | ||
26:SolarisZone | ZoneMonitor | |
The SolarisZone folder/Solaris Zone reports | ||
09:Response_Service | UserResponseMonitor | |
ServiceAvailMonitor | ||
WebTrnMonitor | ||
The ResponseCondition folder/End user response reports | ||
The ServiceCondition folder/HTTP/DNS/SMTP/PORT service reports | ||
The WebTrn folder/Web transaction reports | ||
10:Network | TcpNetworkMonitor | |
No data/Systemwalker Network Manager reports | ||
The TcpNetwork folder/TcpNetwork report | ||
11:Storagemonitor | StorageMonitor | |
The StorageResource folder/Storage reports | ||
12:Systemwalker | OperationMgrMonitor | |
No data/CentricManager reports | ||
The OperationMgr folder/OperationManager reports | ||
13:Interstage (summary) | Interstage(EJB)Monitor | |
Interstage(TD)Monitor | ||
Interstage(CORBA)Monitor | ||
Interstage(IJServer)Monitor | ||
TxnSyncMonitor | ||
TxnAsyncMonitor | ||
ISI SequenceMonitor | ||
ISI QueueMonitor | ||
14:Interstage (detail) | The Interstage folder/Interstage reports | |
The Interstage(TxnAnalysis)JavaEE & The Interstage(TxnAnalysis) folder/no data | ||
The TxnAnalysis(Sync) folder/no data | ||
The TxnAnalysis(Async) folder/no data | ||
ISI folder/ISI reports | ||
15:SymfoWARE | SymfowareMonitor | |
The Symfoware folder/Symfoware reports | ||
16:Oracle | OracleMonitor | |
The Oracle folder/Oracle reports | ||
17:MS-SQL | MS-SQL_Monitor | |
18:MS-NET | MS-.NET_Monitor | |
The MS-.NET folder/MS-.NET reports | ||
19:SAP | SAP Monitor | |
The SAP folder/SAP reports | ||
20:UserDataMonitor | UserDataMonitor | |
21:UserData | UserData folder/Drilled-Down/Report Information (UDATA1 to 20) | |
23:OSResource | No data/P2V simulation reports | |
27:ResourceOrchestrator | VMPoolMonitor | |
StoragePoolMonitor | ||
NetworkPoolMonitor | ||
ServerPoolMonitor | ||
AddressPoolMonitor | ||
Resource Orchestrator folder/Pool (predicted demand) reports |
Note
Agent performance information that can be collected by the Dashboard Server is as follows:
Summary data
Resource data (10 minutes)
By setting the Agents to be monitored, only information from the specified Agents is transferred to the Dashboard Server. This prevents the Dashboard Server from being overloaded with information.
Procedure
Using a Web browser, connect to Analytics Management Console of the Interstage Business Process Manager Analytics.
From the Windows Start menu, click Interstage Business Process Manager Analytics >> Management Console, and then login using the administrator ID and password specified at installation.
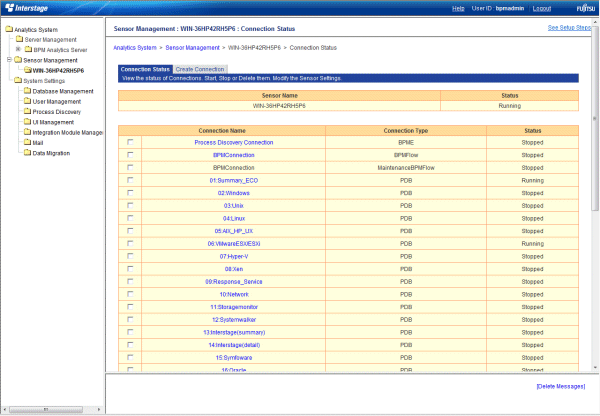
Click Analytics System>> Sensor Management >> <Host name> to display the Connection Status.
Click Connection Name >> 01:Summary_ECO.

Note
When changing the settings of the Agent to be monitored, execute after status of the connection information to be changed is stopped.
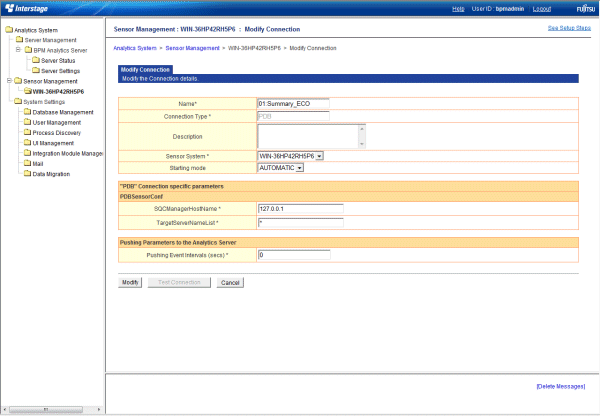
The Modify Connection screen for the 01:Summary_ECO will be displayed. In the PDBSensorConf >>TargetServerNameList*: text box, enter the system name of the Agents you want to monitor using the dashboard. To enter multiple Agents for monitoring, separate the server IP addresses using commas.
Note
When changing the system name of the management target by using the -h option of the sqcSetPolicy (Policy Application Command), enter the changed system name.
For agent for Agentless Monitoring, enter the value of DISPLAYNAME (or HOSTNAME if there is no DISPLAYNAME) in the remote monitoring configuration file created by the Manager/Proxy Manager.
Point
By default, an asterisk is entered in the PDBSensorConf >> TargetServerNameList*: text box. This asterisk indicates that all performance information from Agents that is stored in the PDB will be obtained.
To specify the Agents from which you want to collect information, enter their host names or IP addresses (up to 43,644 alphanumeric characters in length). Use the asterisk wildcard character to allow forward or backward matching to be performed on the host names or IP addresses.
Examples are shown below:
Specify "Win*" to specify host names beginning with "Win".
Specify "*dows" to specify host names ending with "dows".
Specify "*ndo*" to specify host names that include "ndo".
Specify "192.168.0.*" to specify Agents with IP addresses between "192.168.0.0" and "192.168.0.255".

Click the Modify button.
This section explains how to change the collection interval for the monitored data that the Dashboard Server collects from the Manager.
Note
Do not change the data collection interval to one that is smaller than the default setting (10 minutes). Otherwise, the Dashboard Server may become overloaded and unable to collect the data correctly.
Procedure
Login to the Analytics Studio.
From under Collection Rules in the Element Navigation space, select the event for which you want to change the data collection interval.
Select Condition_<event name> from the Collection Rules.
Click the Edit button.
The message "Edit successful" will be displayed.
Click the Timing tab.
In the collection interval column of Schedule, change the time to the collection interval you want.
Click the Save button in the Workspace-Editor.
Click the Share button in the Workspace-Editor.
When sharing is completed, the message "Share successful" will be displayed.
Click OK to close the dialog box.
Click the Ready button in the Workspace-Editor.
When you do so, a dialog box confirming that you want to wait for publishing will be displayed.
Click Yes to wait for release of the dashboard group.
The message "Ready successful" will be displayed.
Click OK to close the dialog box.
Select the Ready tab in the Element Navigation space.
Select the collection condition you want to publish to confirm the definition.
If the definition is correct, select Block based on <eventname> in the Element Navigation space.
If the definition is incorrect, you can click the Reject to reject it.
Click the Publish All Elements to publish the definition.
When you do so, a dialog box confirming that you want to publish the definition will be displayed.
Click Yes to publish the definition.
The message "Publish successful" will be displayed.
Click OK to close the dialog box.
The events listed below are activated as monitored items in the Systemwalker Service Quality Coordinator Dashboard template, and performance information for them is transferred from the Manager to the Dashboard Server.
Event name | Remarks |
|---|---|
PDB_M_SUM_PROC | Monitor information (CPU) |
PDB_M_SUM_MEM | Monitor information (Memory) |
PDB_M_SUM_DISK | Monitor information (Disk) |
PDB_M_SUM_ZONE | Monitor information (ZONE) |
PDB_D_ECO_POWER | Power consumption |
PDB_D_ECO_TEMPERATURE | Temperature |
PDB_M_SUM_VMWVPROC | Monitor information (VMware virtual machine CPU) |
PDB_M_SUM_VMWVMEM | Monitor information (VMware virtual machine memory) |
PDB_M_SUM_VMWVDISK | Monitor information (VMware virtual machine disk) |
PDB_M_SUM_VMWPPROC | Monitor information (VMware virtual host CPU) |
PDB_M_SUM_VMWPMEM | Monitor information (VMware virtual host memory) |
PDB_M_SUM_VMWPDISK | Monitor information (VMware virtual host disk) |
To add other events as monitored items, refer to "4.1.3.1 Dashboard templates". After applying the required template, perform the procedure below.
Note
When you want to add an event as a monitored item or apply a new dashboard template, you must go to Sensor Management in the Interstage Business Process Manager Analytics Management Console and stop all connection information instances with the Connection Type "PDB". Adding a monitored item or uploading and applying a template while these instances are running can take a great deal of time.
Procedure
Use Analytics Studio to enable an event to be monitored.
Login to the Analytics Studio.
From under Collection Rules of the Data collection in the Element Navigation space, select the event for which you want to activate the information to be monitored.
Select Condition_<event name> from the Collection Rules.
Click the Edit Button in the Workspace-Editor.
The message "Edit successful" will be displayed.
Click the Activate button in the Workspace-Editor.
Click the Save button in the Workspace-Editor.
Click the Share button in the Workspace-Editor.
When sharing is completed, the message "Share successful" will be displayed.
Click OK to close the dialog box.
Click the Ready button in the Workspace-Editor. When you do so, a dialog box confirming that you want to wait for release will be displayed.
Click Yes to wait for release of the dashboard group. The message "Ready successful" will be displayed.
Click OK to close the dialog box.
Select the Ready tab in the Element Navigation space.
Click All blocks when Condition_<eventname> is not displayed on the Ready.
Select the collection condition you want to publish to confirm the definition. If the definition is incorrect, you can click the Reject to reject it.If the definition is correct, select Condition_<eventname> in the Element Navigation space.
Click the Publish All Elements to publish the definition.
When you do so, a dialog box confirming that you want to publish the definition will be displayed.
Click Yes to publish the definition.
The message "Publish successful" will be displayed.
Click OK to close the dialog box.
Use Analytics Management Console of the Interstage Business Process Manager Analytics to start the sensors.
Using a Web browser, connect to Analytics Management Console of the Interstage Business Process Manager Analytics.
From the Windows Start menu, click Interstage Business Process Manager Analytics >> Management Console, and then login using the administrator ID and password specified at installation.
Click Analytics System >> Sensor Management >> <Host name> to display the Connection Status.
Select the checkbox for the connection information name of the monitored item, and then click Start.
After confirming that the Status column has changed from Stopped to Running, click Logout.
Point
To stop event information that does not need to be monitored from being transferred to the Dashboard Server clear the Active checkbox.
Use account management to define access privileges to the dashboard.
Refer to "3.2.1.4 Creating Dashboard Users" to create a user.
Refer to the Interstage Business Process Manager Analytics Studio Guide for details.