This section explains the procedure for using the Analytics Studio to release the dashboard templates to users and the procedure for using the dashboard for display.
Information
Refer to the Interstage Business Process Manager Analytics Studio Guide.
Use the Analytics Studio to release the view profile of the dashboard templates to the user created in "3.2.1.4 Creating Dashboard Users"
This section explains the procedure for logging in to the Analytics Studio.
Procedure
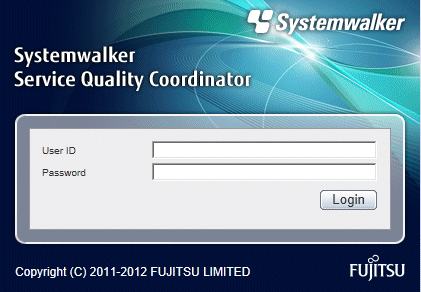
Specify the following URL from a Web browser to display the login window of the Analytics Studio:
http://<IP address of the Dashboard Server>:<Port number*>/ibpmm/ |
*: Default port number: 40330
Login as the user with privileges to use the Analytics Studio that you created in "3.2.1.4 Creating Dashboard Users".

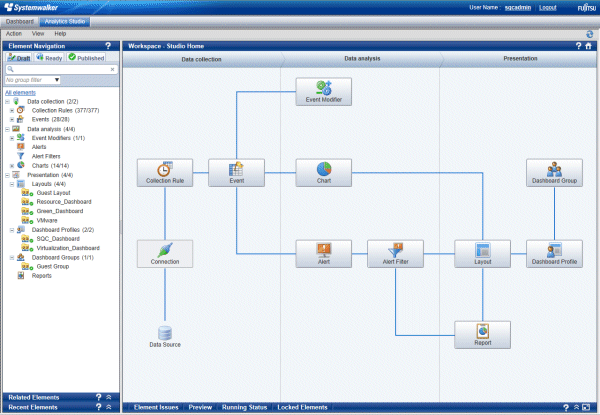
Following Analytics Studio screen is displayed when clicking Analytics Studio tab.

This section explains the procedure for grouping the dashboard users (into Dashboard Groups) to allocate the view profile for the dashboard templates provided.
Procedure
From the menu bar, click Action >> New >> Dashboard Group in that order to display the dialog box for creating the dashboard group.
In the Create Dashboard Group, enter the name of the group you want to create. Entry is mandatory.
Note
Use a unique and meaningful name as the dashboard group name. Any characters, numerics, and spaces can be used in the name. Up to 64 characters can be entered.
Click the Next button to proceed with the definition.
In the Overview Layout, specify Guest Layout.
Click the Next button to proceed with the definition.
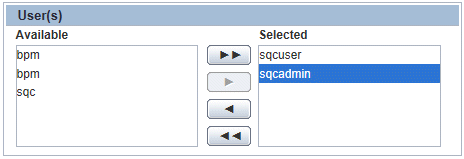
Select the users you want to allocate to the dashboard group. From the Available box, select the user created in "3.2.1.4 Creating Dashboard Users" and then click the arrow button to add the user to the Selected box.

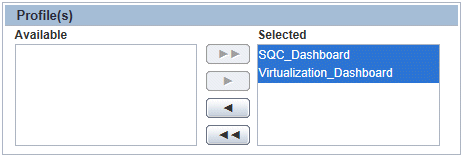
Apply a view profile to the dashboard group. From the Available box, select SQC_Dashboard and Virtualization_Dashboard and then click the arrow button to add the view profile to the Selected. This determines which information the user will be able to view from the dashboard.

Click the Next button to proceed with the definition.
Clear the Edit Chart and the Update Alert status checkbox selections.
Click the Finish button to create the dashboard group. The dashboard group that is created will be displayed under the dashboard groups in the Element Navigation space.
In order to receive a review of the dashboard group details, you must apply the Ready. This section explains the procedure for applying the Ready to the dashboard group.
Procedure
Select the created dashboard group from the Dashboard Groups in the Element Navigation space.
Click the Share button in the Workspace-Editor. When sharing is completed, the message "Share successful" will be displayed.
Click OK to close the dialog box.
Click the Ready button in the Workspace-Editor. When you do so, a dialog box confirming that you want to wait for release will be displayed.
Click Yes to wait for release of the dashboard group. The message "Ready successful" will be displayed.
Click OK to close the dialog box.
This section explains the procedure for publishing the dashboard group. By publishing, you will be able to use the dashboard for display.
Procedure
Select the Ready tab in the Element Navigation space.
Select the dashboard group you want to release to confirm the definition. If the definition is incorrect, you can click the Reject to reject it.
If the definition is correct, select the Block based on Guest Group in the Element Navigation space.
Click the Publish All Elements to release the definition. When you do so, a dialog box confirming that you want to release the definition will be displayed.
Click Yes to release the definition. The message "Publish successful" will be displayed.
Click OK to close the dialog box.
Note
Log out once and log in again to display the Dashboard after executing "Publishing" procedure.
This section explains the procedure for logging in to the dashboard.
Procedure
Specify the following URL from a Web browser to display the login window of the Analytics Studio:
http://<IP address of the Dashboard Server>:<Port number*>/ibpmm/ |
*: Default port number: 40330
Login as the user with privileges to use the dashboard that you created in "3.2.1.4 Creating Dashboard Users".

Select KPIs >> SQC_Dashboard >> Resource_Dashboard to display the dashboard with CPU, memory, and disk information.
Select KPIs >> SQC_Dashboard >> Green_Dashboard to display the dashboard with power consumption and temperature information.
Select PKIs >> Virtualization_Dashboard >> WMware to display the dashboard with server resource information for VMware host and guest servers.
Point
When there are a large number of legend items shown in one chart, not all legend items will be displayed. To see more legend items, either increase the legend display area by dragging the center of the chart (circled in red in the diagram below), or maximize the whole chart.
