When report is selected, setting items about the target will be displayed. The items vary depending on report you selected.
Below is an example for selecting system group and host.
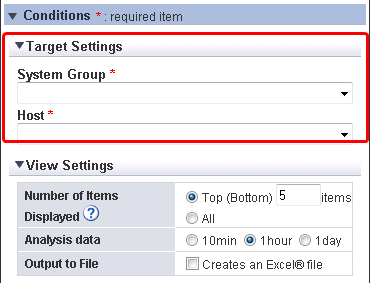
The following explains the items respectively.
System group specification
Item | Description |
|---|---|
System Group | Select the system group to be analyzed from the drop-down list box. |
System group and host specification
Item | Description |
|---|---|
System Group | Select the system group to be analyzed from the drop-down list box. |
Host | Select the host to be analyzed from the drop-down list box. The list box displays the hosts that have been registered with the selected system group. |
System group, host and resource ID specification
Item | Description |
|---|---|
System Group | Select the system group to be analyzed from the drop-down list box. |
Host | Select the host to be analyzed from the drop-down list box. The list box displays the hosts that have been registered with the selected system group. |
Resource ID | The content specified for Resource ID depends on the type. The content that can be input for each type of report is explained below. Note that only alphanumeric characters and symbols (except for \,<>"$'[]=&) can be used. The maximum length is 128 characters. |
For future forcast display only
Item | Description |
|---|---|
System Group | Select the system group to be analyzed from the drop-down list box. |
Host | Select the host that to be analyzed from the drop-down list box. The list box displays the hosts that have been registered with the selected system group. ALL_SERVER means all the hosts of the system group. |
Record ID | Specify the target record id and field name for the analysis. For the record id, only options corresponding to the selected host will be displayed. For the field name, only options corresponding to the selected record ids will be displayed. If the Display by difference checkbox is selected, information for cumulative values can be displayed incrementally. Refer to "Drilled-Down/Report Information" in the Reference Guide for details on the record id and field names that can be specified. |
Field Name | |
Display by difference | |
Resource ID | Specify the resource ID to be targeted for analysis. If nothing is specified, all resource IDs will be targeted. Point Resource IDs can be retrieved by right-truncating the resource ID according to a specified search string. Example: For example, if the two resource IDs "AAA123" and "AAA456" exist, both can be targeted by specifying "AAA". |
Detailed specification
Item | Description |
|---|---|
System Group | Select the system group to be analyzed from the drop-down list box. |
Host | Select the host to be analyzed from the drop-down list box. The list box displays the hosts that have been registered with the selected system group. When ALL_SERVER is selected, all hosts in the system group are analyzed. |
Record ID | Specify the target record id and field name for the analysis. For the record ID, only options corresponding to the selected host will be displayed. For the field name, only options corresponding to the selected category name will be displayed. If the Display by difference checkbox is selected, information for cumulative values can be displayed incrementally. Refer to "Drilled-Down/Report Information" in the Reference Guide for details on the record id and field names that can be specified. |
Field name | |
Display by difference | |
Resource ID | Specify the resource ID to be targeted for analysis. If nothing is specified, all resource IDs will be targeted. Point Resource IDs can be retrieved by right-truncating the resource ID according to a specified search string. Example: For example, if the two resource IDs "AAA123" and "AAA456" exist, both can be targeted by specifying "AAA". |
Regarding the summary data time-series display, when agents that have different collection intervals are in the same system group, the graph display will be affected if ALL_SERVER is selected. If the Display by difference checkbox is selected, some servers may not be displayed. Create system groups of agents that have same collection intervals.
For correlation/composition only
Item | Description | |
|---|---|---|
System Group | Select the system group to be analyzed from the dropdown list box. | |
Data 1 specification Data 2 specification | Host1 Host2 | Select a host containing some of the data to be displayed from the drop-down list box. The list box displays the hosts that have been registered with the selected system group. When ALL_SERVER is selected, all hosts in the system group are targeted. |
Record ID1 Record ID2 | Specify one of the record id/field name pairs to be displayed. For the record ID, only options corresponding to the selected hosts will be displayed. For the field name, only options corresponding to the selected record id will be displayed. If the Display by difference checkbox is selected, information for cumulative values can be displayed incrementally. Refer to "Drilled-Down/Report Information" in the Reference Guide for details on the record id and field names that can be specified. | |
Field name1 Field name2 | ||
Display by difference | ||
Resource ID1 Resource ID2 | Specify one of the resource IDs to be displayed. If nothing is specified, all resource IDs will be targeted. Point Resource IDs can be retrieved by right-truncating the resource ID according to a specified search string. Example: If the two resource IDs "AAA123" and "AAA456" exist, both can be targeted by specifying "AAA". | |
For contour display only
Item | Description |
|---|---|
System Group | Select the system group to be analyzed from the drop-down list box. |
Host | Select the host to be analyzed from the drop-down list box. The list box displays the hosts that have been registered with the selected system group. When ALL_SERVER is selected, all hosts in the system group are analyzed. |
Record ID | Specify the target record id and field name for the analysis. For the field name, only options corresponding to the selected record id will be displayed. If the Display by difference checkbox is selected, information for cumulative values can be displayed incrementally. Refer to "Drilled-Down/Report Information" in the Reference Guide for details on the record id and field names that can be specified. |
Field name | |
Display by difference | |
Resource ID | Specify the resource ID to be targeted for analysis. If nothing is specified, all resource IDs will be targeted. Point Resource IDs can be retrieved by right-truncating the resource ID according to a specified search string. Example: For example, if the two resource IDs "AAA123" and "AAA456" exist, both can be targeted by specifying "AAA". |
For comparison display of the past only
Item | Description |
|---|---|
System Group | Select the system group to be analyzed from the drop-down list box. |
Host | Select the host to be analyzed from the drop-down list box. The list box displays the hosts that have been registered with the selected system group. When ALL_SERVER is selected, all hosts in the system group are analyzed. |
Record ID | Specify the target record id and field name for the analysis. For the field name, only options corresponding to the selected record id will be displayed. If the Display by difference checkbox is selected, information for cumulative values can be displayed incrementally. Refer to "Drilled-Down/Report Information" in the Reference Guide for details on the record id and field names that can be specified. |
Field name | |
Display by difference | |
Resource ID | Specify the resource ID to be targeted for analysis. If nothing is specified, all resource IDs will be targeted. Point Resource IDs can be retrieved by right-truncating the resource ID according to a specified search string. Example: For example, if the two resource IDs "AAA123" and "AAA456" exist, both can be targeted by specifying "AAA". |
Report base day | Specify the target date for comparison. |
For transition comparison display according to day display only
Item | Description |
|---|---|
System Group | Select the system group to be analyzed from the drop-down list box. |
Host | Select the host to be analyzed from the drop-down list box. The list box displays the hosts that have been registered with the selected system group. When ALL_SERVER is selected, all hosts in the system group are analyzed. |
Record ID | Specify the target record id and field name for the analysis. For the field name, only options corresponding to the selected record id will be displayed. If the Display by difference checkbox is selected, information for cumulative values can be displayed incrementally. Refer to "Drilled-Down/Report Information" in the Reference Guide for details on the record id and field names that can be specified. |
Field name | |
Display by difference | |
Resource ID | Specify the resource ID to be targeted for analysis. If nothing is specified, all resource IDs will be targeted. Point Resource IDs can be retrieved by right-truncating the resource ID according to a specified search string. Example: For example, if the two resource IDs "AAA123" and "AAA456" exist, both can be targeted by specifying "AAA". |
For P2V simulation display only
Item | Description | |
|---|---|---|
System Group | Select the target system group for P2V simulation from the drop-down list box. | |
Aggregation candidate | First click the Add button to display the Add Aggregation candidate view, then select the candidates and click OK. More than 1 candidate can be selected. The selected hosts will be listed. The maximum number of candidates is 50. If you want to set aside a host that has been selected as candidate, click Delete button at the right of the host. | |
Aggregation target's information | Direct input of installed resource/Aggregate to a host in operation | If the target host has been registered in the system group, select [Aggregate to a host in operation]. The amount of CPU and Memory of the specified host will be displayed as black lines in the displayed graph. If not registered, select [Direct input of installed resource]. |
CPU | If [Direct input of installed resource] is selected, specify the CPU clock (GHz), core number and memory (GB) of the target server by value.
The specified information about CPU and Memory will be displayed as black lines in the displayed graph. | |
Host | If [Aggregate to a host in operation] is selected, select target host from the drop-down list box. It can not be the same as an aggregation candidate. | |
Note
If monitored using an agent of V13.5.0 or before, the server will not be listed as aggregation candidate or aggregation target.
If you want to make a virtual machine as aggregation candidate, monitoring the server performance (OS) of the virtual machine by agent of agent-based monitoring or agentless monitoring.
For VMware virtual machine relocation simulation only
Item | Description | |
|---|---|---|
System Group | Select the target system group for virtual machine relocation simulation from the drop-down list box. | |
Relocation candidate | Host Virtual machine | First click the Add button to display the Add Relocation candidate view, and then select from the list box the host moving from. From Virtual machine list, select the virtual machine for the relocation candidate and click OK button. More than 1 virtual machine can be selected. If you want to add virtual machines for relocation candidate from more than 1 virtual host, repeat the above procedure. |
Relocation candidate | The selected relocation candidates will be displayed. Display format is "host name:virtual machine name". The maximum number of relocation candidates is 50. The maximum number of selectable hosts that holding the virtual machines of relocation candidate is 5. If you want to set aside a host that has been selected as the relocation candidate, click the Delete button on the right of the host. | |
Aggregationtarget's information | Direct input of installed resource/Aggregate to a host in operation | If the target host has been registered in the system group, select [Aggregate to a host in operation]. The amount of CPU and Memory of the specified host will be displayed as black lines in the displayed graph. If not registered, select [Direct input of installed resource]. |
Host | If [Aggregate to a host in operation] is selected, select target host from the drop-down list box. It can not be the same as an relocation candidate. | |
CPU | If [Direct input of installed resource] is selected, specify the CPU clock (GHz), core number and memory (GB) of the target server by value.
The specified information about CPU and Memory will be displayed as black lines in the displayed graph. | |
Note
The target for virtual machine relocation simulation is VMware only.
If monitored using an agent of V13.5.0 or before, the server will not be listed as relocation candidate or aggregation target.
The virtual host which has stopped for over 5 hours will not be displayed in the list of the virtual machine of the relocation candidate.
Immediately after the virtual machine migration, select the virtual machine by the name before migration. The list of virtual machines is updated once an hour.
For request count (Future prediction) only
Item | Description |
|---|---|
System Group | Select the target system group for analysis from the drop-down list box. |
Host | Select the target host for analysis from the drop-down list box. For the host, only those registered in the selected system group will be displayed. ALL_SERVER means all the hosts in the system group. |
Service Name | Specify the service name (resource ID) set according to Managing the Volume of Web Transactions. All the services will be extracted if omitted. Resource IDs can be retrieved by right-truncating the resource ID according to a specified search string. |
For response simulation (Request count/Adding servers) only
Item | Description |
|---|---|
System Group | Select the target system group for analysis from the drop-down list box. |
Server Group (layer 1) | Hosts registered in the system group will be divided into Web server (layer 1), application server (layer 2) and database server (layer 3). First click Add button to display Add Host view, then from Host list, select a host and click OK button. Make sure you specify host that holding agents with Managing the Volume of Web Transactions to Server Group (layer 1). Server Group (layer 2) and Server Group (layer 3) can be ignored. Maximum number of total hosts that can be added to layer 1 to 3 is 50. Point The performance information used for application server and database server is CPU informaation. The setting of linkage middleware such as Interstage Application Server and Symfoware Server is unnecessary. |
Server Group (layer 2) | |
Server Group (layer 3) | |
Service Name | Specify the service name(resource ID) set according to Managing the Volume of Web Transactions. All the services will be extracted if omitted. Resource IDs can be retrieved by right-truncating the resource ID according to a specified search string. |
Request Coefficient | Specify the expected request count (times compared with now). Make use of request count(Future prediction) to predict this value. If 1 is specified, current request count will be used in simulation. Range: from 0.1 to 9999.9 |
Adding Servers | This will be displayed in case of Response simulation (Adding servers). Specify the number of servers adding to each server group. Range: from 0 to 99 |
Times other than service time | Specify the period when the service is not running or the request count is very few, such as late night, holiday or scheduled maintenance time. The precision of simulation will become higher, if your exclude such periods of time during which processing that have nothing to do with request is be performed. Select the week day, hour, minute from drop-down list box to specify the week day and period of time for Times other than service time. The maximum number of conditions that can be specified is 10. Point The values of table of response(request count) and response(adding servers) are displayed as '-'(hyphen) for the period of time specified by "All". |
For service operational information only
Item | Description |
|---|---|
System Group | Select the system group to be analyzed from the drop-down list box. |
Specified the resource ID content of each report type is shown.
Report type | Resource ID |
|---|---|
Web transaction request | The following specified content differs according to the type: In the report of the following, the service name is specified. For Generic report, specify the service name and the URL connected by a colon (:). Example: imagine:/SSQC/console.html If only the service name is specified, all the data for that service name will be targeted for reporting. Note Please specify what defined with Inclusion of Transaction Log Definitions file (tlawatch.ini) for URL. Please refer to User's Guide "Transaction Log Definitions" for Transaction Log Definitions file (tlawatch.ini). |
Web transaction hitserver | |
Web transaction hitclient | |
Web transaction hitremote | |
Web transaction traffic | |
Web transaction error | |
Interstage EJB application | Specify the name of an EJB application. To monitor the performance of an EJB container, specify the name of the EJB container. |
Interstage CORBA application | Specify the implementation repository ID. |
Interstage transaction application | Specify the object name. |
Interstage IJServer JVM | Specify the object name. |
Interstage IJServer JTA | |
Interstage IJServer JDBC | |
Interstage IJServer SERVLET WebModule | |
Interstage IJServer EVENT SERVICE | |
Symfoware shared buffer | Specify the RDB system name. Point Using alphanumeric characters is recommended. |
Symfoware log area | |
Symfoware disk I/O | |
Oracle SGA | Specify the instance name. Point Using alphanumeric characters is recommended. |
Oracle PGA | |
Oracle disk I/O | |
Oracle resource conflict | |
Operation Manager subsystem | Specify the subsystem name. Example: subsystem00 |
Operation Manager queue | Specify the subsystem name and the queue name connected by a colon (:). Example: subsystem00:queue1 |
Operation Manager project | Specify the subsystem name and the project name connected by a colon (:). Example: subsystem00:project5 |
Network Manager network traffic | Specify the node name and the host name connected by a colon (:). Example: node1:interface1 |
Network Manager CPU load | Specify the node name. |
Network Manager collision | Specify the node name and the host name connected by a colon (:). Example: node1:interface1 |
Network Manager CRC Error | |
Network Manager drop packet | |
Network Manager transfer packet | |
Network Manager discard packet | |
Network Manager error packet | |
Network Manager IP operating rates | Specify the node name. |
NetworkManager RTT | Specify the node name. |
TcpNetwork | Specify the interface name. |
Storage CM CPU usage rate | Specify the Storage ID and the CM ID connected by a colon (:). Example: Point This string is displayed in the resource ID column by selecting "CM" under "Storage" with the Drilled-Down display view. |
Storage disk busy | Specify the Storage ID and the Disk ID connected by a colon (:). Example: 00GR730#######GR73E02U####IA000003######:0x0 Point This string is displayed in the "Resource ID" column by selecting "Disk" under "Storage" with the Drilled-Down display view. |
Storage throughput | Specify the Storage ID and the RAIDGroup ID connected by a colon (:). Example: 00GR730#######GR73E02U####IA000003######:0x0 Point This string is displayed in the "Resource ID" column by selecting "RAIDGroup" under "Storage" with the Drilled-Down display view. |
Storage IOPS | |
Workload | Specify resource module names separated by a colon (:). Example 1: To specify a single module name module1: Example 2: To specify multiple module names module1:module2: If no name is specified, all modules will be targeted. |
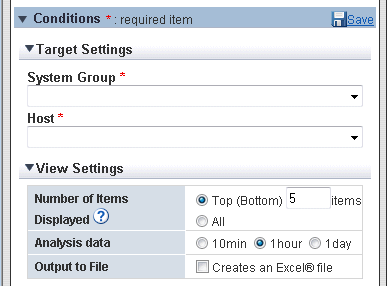
When the report is specified, a set item concerning the display is displayed. The content is different depending on the specified report type.
It is an example of the screen of specifying the display number, the analysis data, and the File output as follows.
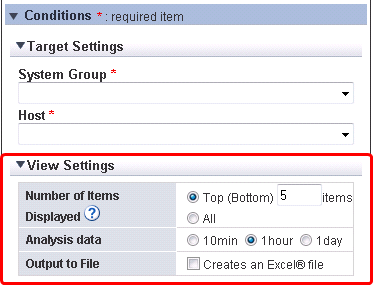
Item | Description |
|---|---|
Number of Items Displayed | The number of datas when analyzing it is selected. An optional data number is the following.
|
Analysis data | The interval of the data when analyzing it is selected. An optional data interval is the following.
Note Even if it specifies for the period for the data-hold period, the data is not displayed. |
Output to File | The content of contents is output as a File of the Excel(R) form. When "Creates an Excel(R) file" check box is checked, "Save in Excel(R) format" button the analysis and under the report contents becomes effective. Contents displayed to click this button can be downloaded by the Excel(R) form. Note Please nullify redirecting of the clipboard when operating it by a remote, desktop connection etc. Note When the file is downloaded from "Save in Excel(R) format", the file of the extension of xlsx or xlsm can be downloaded. Please make macro effective when you open the file of the extension of xlsm. Information Please change Internet Explorer settings in the case the file of the xml form is downloaded when the file is downloaded from "Save in Excel(R) format". Internet Options > Security tab > Custom level of corresponding zone > Miscellaneous. Disable Open files based on content, not file extension. |
Times other than service time | The time zone that becomes the Element of the display is specified. The operation initiating season and the end season are specified. |
Threshold(Arbitrariness): | CPU utilization and the memory percentage utilisation that allows it by the server consolidating ahead are specified by the percentage. (It is possible to omit it.) It is displayed in a red line in the displayed graph when specifying it. CPU: Please input the number of 10-100. (unit: %) The memory: Please input the number of 10-100. (unit: %) |
Analysis mode | The simulation method is specified.
|
"Detail Settings" is displayed by the kind of the report. The content is different depending on the kind of the specified report.
"Detail Settings" is displayed at the report Selection while having shut. Please click the titlebar of "Detail Settings" when setting it in detail.
Figure 4.1 "Detail Settings" region closed.
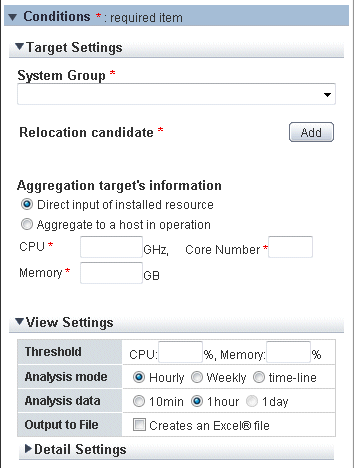
Figure 4.2 "Detail Settings" region opened.
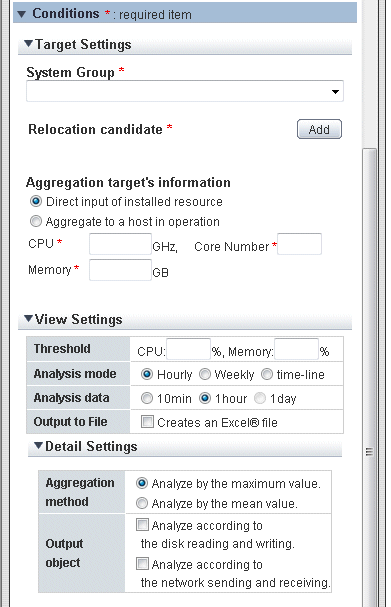
Generic report
Item | Description |
|---|---|
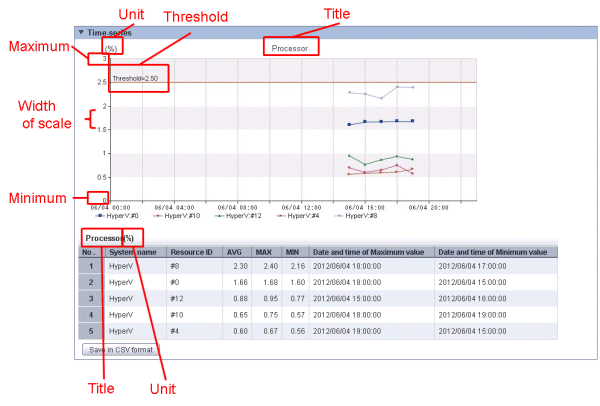
Title | The title of the graph and the table is specified. Please refer to figure below "Graph that was details set and displayed (Example)" for the image when it specifies it. The following characters can be used for the title.
The platform dependent character cannot be used. The limitation of length is within 24 characters. The record identity is displayed to the graph title in the title of the field name and the table when not specifying it. |
Unit | The unit of Y axis in the graph is specified. Please refer to figure below "Graph that was details set and displayed (Example)" for the image when it specifies it. The following characters can be used for the unit.
The platform dependent character cannot be used. The limitation of length is within 8 characters. The unit is not displayed when not specifying it. |
Graph Size | The size in the output graph is specified in every the pixel. The integer from 200 to 1500 can be specified. Default is 700 pixels in width, and 300 pixels in height. (Contour mappings are 750 pixels in width, and 500 pixels in height.) The specification of the value more than the default value is recommended. |
Graph Range(Y Axis) |
|
Threshold | The threshold is specified. Please refer to figure below "Graph that was details set and displayed (Example)" for the image when it specifies it. The numerical value within the range of 10000000000000 can be specified from -10000000000000. It is likely not to be displayed in the graph according to the range of Y axis even if it specifies it. |
Figure 4.3 Graph that was details set and displayed (Example)
Another
Item | Description | |
|---|---|---|
Output object | Analyze according to the disk reading and writing. | To display the distribution graph and the table of reading and writing, it selects it. |
Analyze according to the network sending and receiving. | To display the distribution graph and the table according to sending and receiving, it selects it. | |
Graph setting(X Axis) | CPU usage rate | When the graph is set, it selects it. |
Memory usage rate | When the graph is set, it selects it. | |
Disk I/O Count | When the graph is set, it selects it. All graphs are common to this setting. | |
Disk Throughput | When the graph is set, it selects it. All graphs are common to this setting. | |
Count for data sent/received over network | When the graph is set, it selects it. All graphs are common to this setting. | |
Network Throughput | When the graph is set, it selects it. All graphs are common to this setting. | |
Aggregation method | Analyze by the maximum value. | Whether whether it analyzes it by the maxima is analyzed by the mean value is selected. |
Analyze by the mean value. | ||
Threshold | The threshold is specified by the percentage. "Threshold": Please input the integer of 1-100. (unit: %) | |
Server Group (layer 1) | The displayname of the server group is specified. The following characters can be used for the displayname.
The platform dependent character cannot be used. The limitation of length is within 36 characters. | |
Server Group (layer 2) | ||
Server Group (layer 3) | ||
The condition of setting it by "Conditions" can be preserved for "My Category" by clicking "Save".
The superscription is preserved in the report that has been selected or it preserves it by the alias.
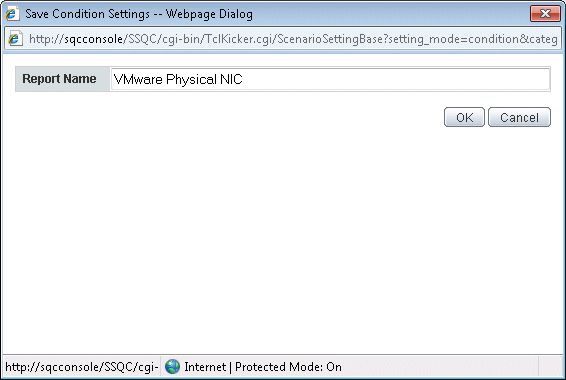
Item | Description |
|---|---|
Report Name | The name of the report selected by "Scenario" is displayed. If report-name is not changed, the selected report is preserved in the superscription. It is added to the category selected by the report "Scenario" of the name specified that report-name is changed. The following characters can be used for the displayname.
The platform dependent character cannot be used. The limitation of length is within 50 characters. |