It explains the operating instruction of Analysis/Plannning Window.
Note
The following problems sometimes occur when users try to display the desired contents (graphs or tables).
- The operation terminates with error code 1572864.
- "Chart is unavailable" is displayed instead of the graph image.
- The graph image may be left out (only graphs are not displayed).
- The following error message may be displayed.
"The specified CGI application misbehaved by not returning a complete set of HTTP headers. The headers it did return are: Unable to register TclNotifier window class" "ohd_update error." "Ohd file create error." |
These problems may be due to insufficient space in the desktop heap for the operation management client. Increase the size of the desktop heap by referring to "6.1 Content Display Errors".
Starting
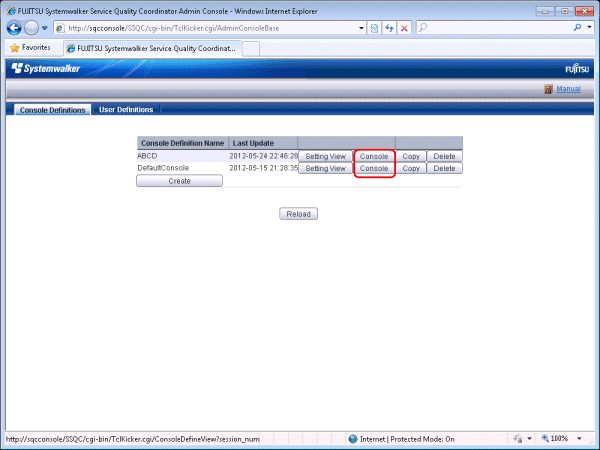
Start the Console by clicking the Console button on the Console Definitions tab of the Admin Console window.

Or start the Console directly by specifying the URL.
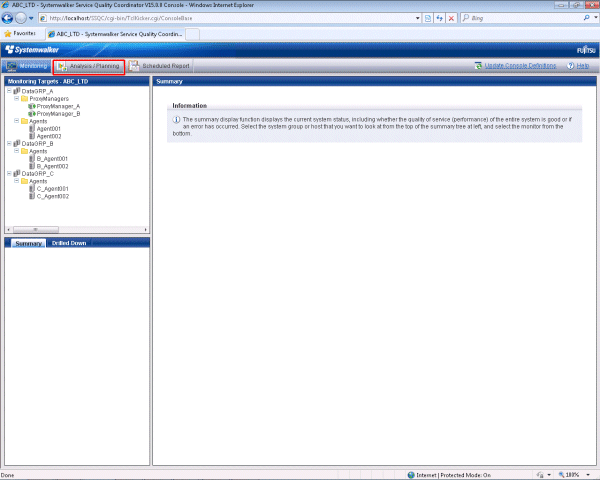
Click on the Analysis/Planning menu from the global navigation bar in the Console to start.

Note
Do not perform operations in the Analysis/Planning window using the pop-up context menu that appears when the right mouse button is clicked.
Analysis/Planning Window configuration
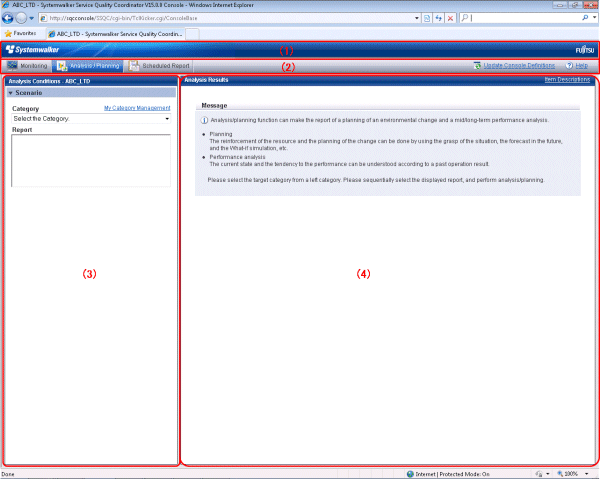
The Analysis/Planning window will appear as below.

The Analysis/Planning window is organized as shown in the following table.
Item No. | Component | Description |
|---|---|---|
(1) | Global header | The Systemwalker and Fujitsu logos are displayed. |
(2) | Global navigation bar | The menus are as follows: - Monitoring Opens the monitoring window. Allows checks on the current status and isolates faults when they occur. - Analysis/Planning Opens the analysis/Planning window. A mid/long-term analysis and the planning of the service quality to avoid future problems. - Scheduled Report Opens the scheduled report window. Displays reports about service levels for the customer or for capacity planning. - Update Console Definition Reloads the console definitions. - Help Opens the User's Guide (Console Edition). |
(3) | Analysis conditions area | The analytical condition in the selection of the category and the report and each report is set and it is possible to register. It explains the operating instruction of the Analysis conditions area by the next paragraph. |
(4) | Content display area | Contents of each report are displayed. |
Basic operation of Analysis/Planning Window
The Analysis/Planning windows perform the following operation
Operation | Description |
|---|---|
The report is made by using the scenario | The analysis and the planning along the purpose the report displayed in the category is sequentially confirmed can be done. The My Category of the template and each console that the product offers that the user registers can be used. The condition of Analysis/Planning can be preserved for the My Category. |
Refer to the history of the made report | The history of the made report is displayed. The analysis window history can store up to 50 reports. If this number is exceeded, reports will be automatically deleted in chronological order. |
The My Category is edited | The following of the My Category of each console that the user registers can be done.
|
See
Please refer to "Basic operation of Analysis conditions area" for the operating instruction of the analytical condition.
Analysis conditions area configuration

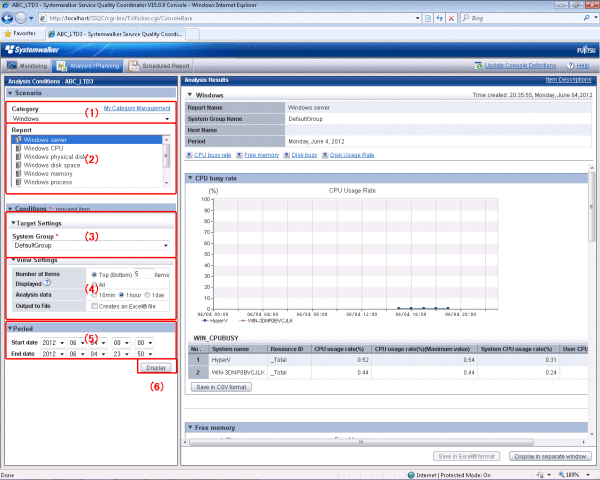
Basic operation of Analysis conditions area
Item No. | Component | Description |
|---|---|---|
(1) | Categories | The Category is selected according to the purpose of the operation. |
(2) | Report | The Report is selected according to the purpose of the operation. |
(3) | Target Settings | It specifies it concerning the object of the report. |
(4) | View Settings | Specifies the data interval, the number of display items and File output for the report. The way the number of display items is displayed depends on the report types
the high CPU usage rates by the process in the troubleshooting. Available memory capacity is extracted by the low-ranking number to prevent the system down by insufficient memory. The number of data items to display in the report is about up to 10. The graph might collapse by explanatory notes in case of ten or more. The setting of the graph size etc. can be done by a Detail Settings according to the kind of the report. |
(5) | Period specifications | Specifies the periods for analysis. |
(6) | Operation buttons(to display) | Button for displaying the results of analysis as content. |