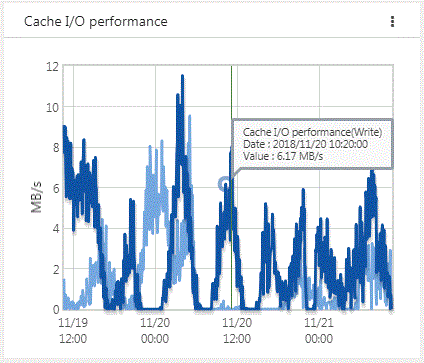
Cache I/O performance is displayed on the Cache I/O performance panel of the CSG Web GUI dashboard.
You can check the cache I/O performance to determine if the cache performance is creating a bottleneck when transferring to the cloud provider.
Figure 4.7 Example of Information Displayed on the Cache I/O Performance Panel

Cache I/O performance is displayed as a line graph in five minutes increments. The display range covers two days (fixed).
The light blue line graph indicates Cache I/O performance(Read), and the dark blue line graph indicates Cache I/O performance(Write).
If you focus any area on the graph, the date, time, and performance information is displayed for that tooltip on the graph.
Item | Description |
|---|---|
Vertical axis | Displays the performance value. |
Horizontal axis | Displays the date and time. |
Light blue line graph | Displays the Read throughput to cache when reading from shared folders. |
Dark blue line graph | Displays the Write throughput to cache when writing to shared folders. |