In the Main Screen, object configuration and status viewing and status monitoring can be performed.
Select [SDX Object] in the [View]:[Details] menu to view object configurations according to the following units.
Object configuration within a node
Object configuration within a class
Object configuration within a group
Object configuration within a single disk
Object configuration within a volume
For GDS Snapshot shadow objects, the object names, the status and so on are displayed in italics.
Object configuration within a node
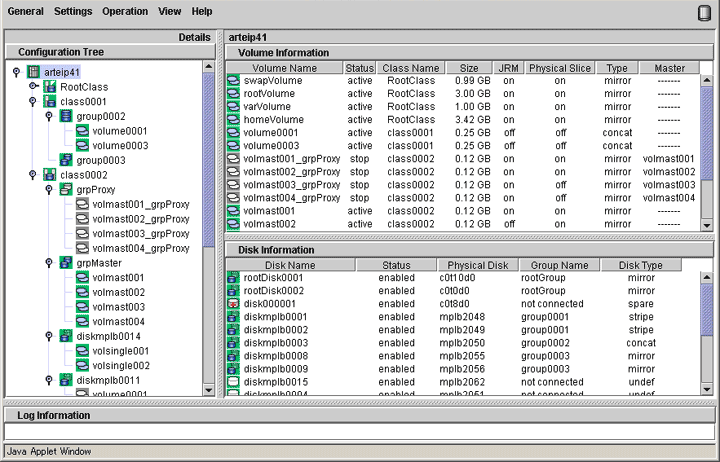
Click the node icon in the Configuration Tree field, and all volumes and disks within the specified node appear.
Figure 5.46 Main Screen (for SDX Objects of a Node)
Object configuration within a class
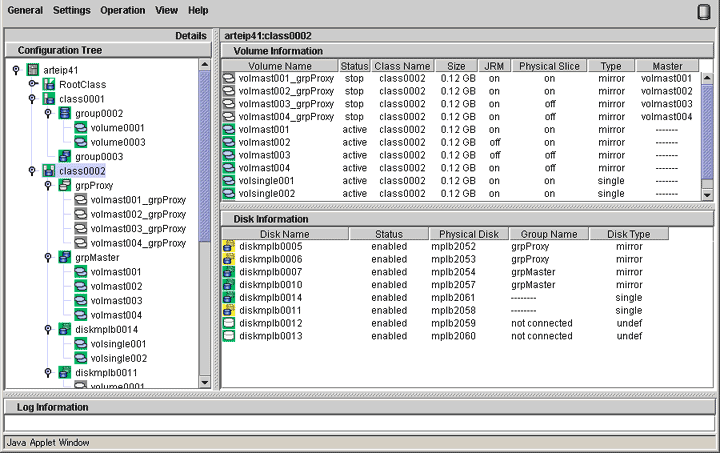
Click the class icon in the Configuration Tree field, and all volumes and disks within the class appear.
Figure 5.47 Main Screen (for SDX Objects of a Class)
Object configuration within a group
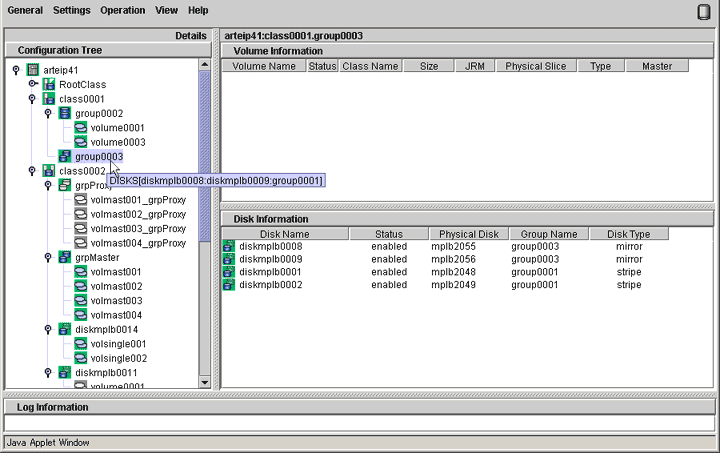
Click a group icon in the GDS configuration tree field, and all volumes and disks at any level within the specified group appear. Additionally, place a mouse pointer on a group icon, and the disks and lower level groups constituting the group appear.
Figure 5.48 Main Screen (for SDX Objects of a Group)
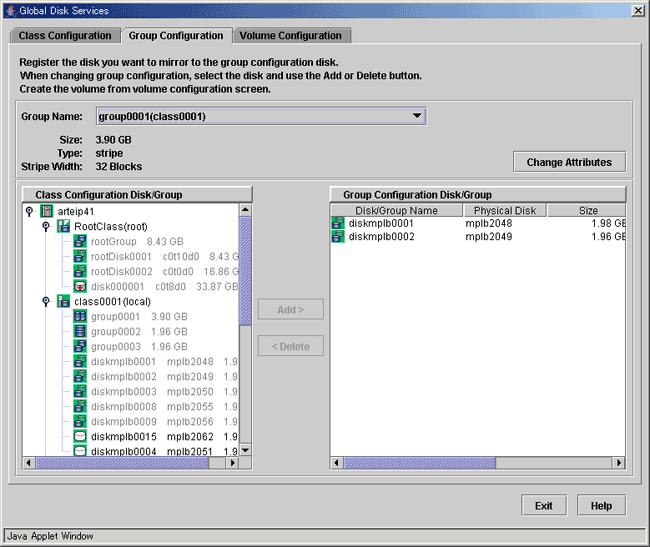
Groups displayed in the GDS configuration tree field are only the highest level groups. You can view the disks and lower level groups constituting their lower level groups in the Group Configuration screen.
Perform the following procedure.
Display the Group Configuration screen.
Select [Group Configuration] in the [Settings] menu on the Main screen, and the Group Configuration screen will appear.
Select the group you want to view the configuration in the [Group Name] list.
In the [Group Configuration Group/Disk] field, view the disks and lower level groups constituting the group.
In this example, group group0003 has disk diskmplb0008, diskmplb0009 and lower level group group0001. In a similar manner, view the configuration of lower group group0001.
Figure 5.49 Confirming Group Configuration Group/Disk
Object configuration within a single disk
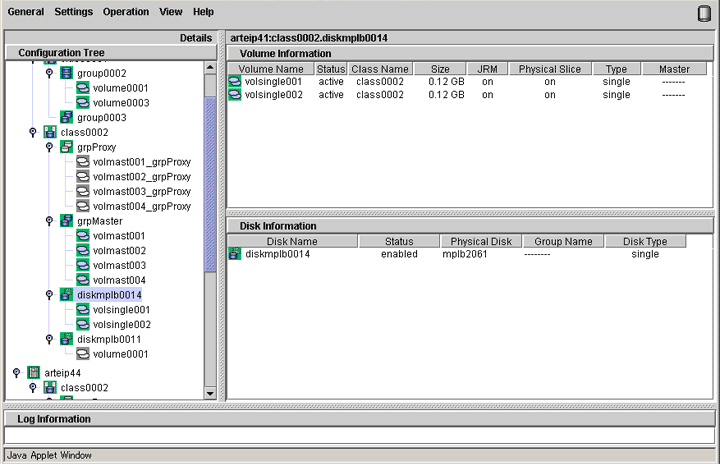
Click a single disk icon in the GDS Configuration Tree Field to view all the volumes within the single disk as well as the single disk.
Figure 5.50 Main Screen (for SDX Objects of a Single Disk)
Object configuration within a volume
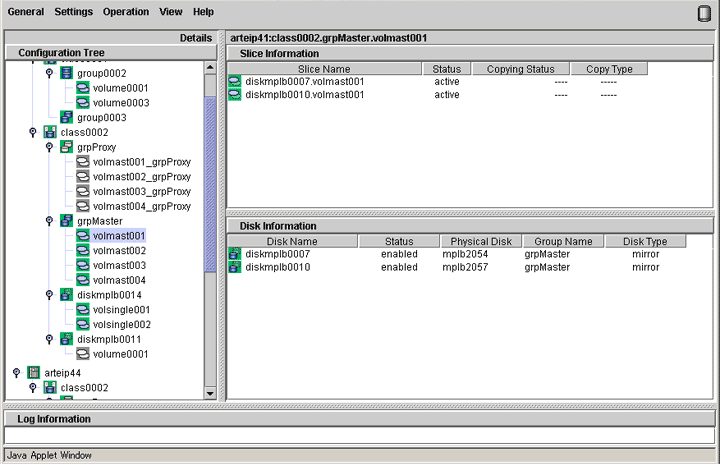
Click the volume icon in the Configuration Tree field, and all slices and disks within the specified volume appear.
Figure 5.51 Main Screen (for SDX Objects of a Volume)
Select [Proxy Object] in the [View]:[Details] menu to view object configurations according to the following units.
Proxy object configuration within a node
Proxy object configuration within a class
Proxy object configuration related to a group
Proxy object configuration within a single disk
Proxy object configuration related to a volume
Proxy object configuration within a node
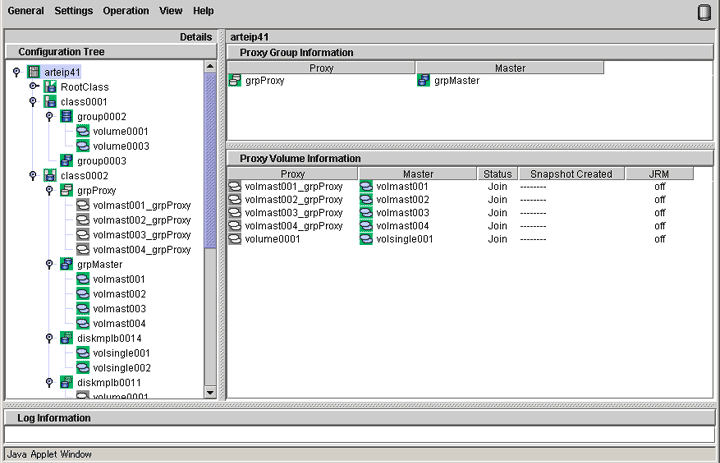
Click the node icon in the Configuration Tree field, and all proxy groups and proxy volumes within the specified node appear.
Figure 5.52 Main Screen (for Proxy Objects of a Node)
Proxy object configuration within a class
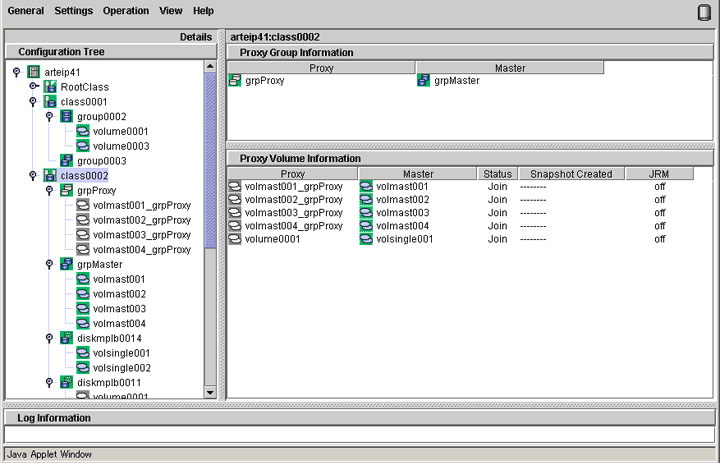
Click the class icon in the Configuration Tree field, and all proxy groups and proxy volumes within the class appear.
Figure 5.53 Main Screen (for Proxy Objects of a Class)
Proxy object configuration related to a group
Click a group icon in the GDS Configuration Tree Field to view the following configuration information.
All the master groups or proxy groups related to that group
All the proxy volumes within that group and within proxy groups related to it
Figure 5.54 Main Screen (for Proxy Objects of a Group)
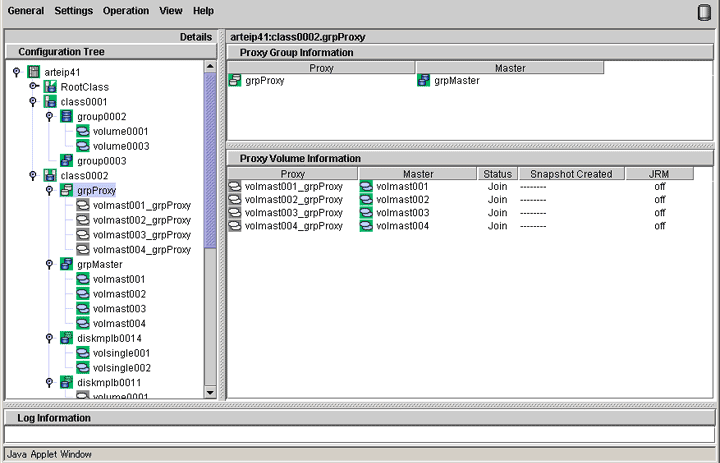
Proxy object configuration within a single disk
Click a single disk icon in the GDS Configuration Tree Field to view all the proxy volumes within that single disk.
Figure 5.55 Main Screen (for Proxy Objects of a Single Disk)
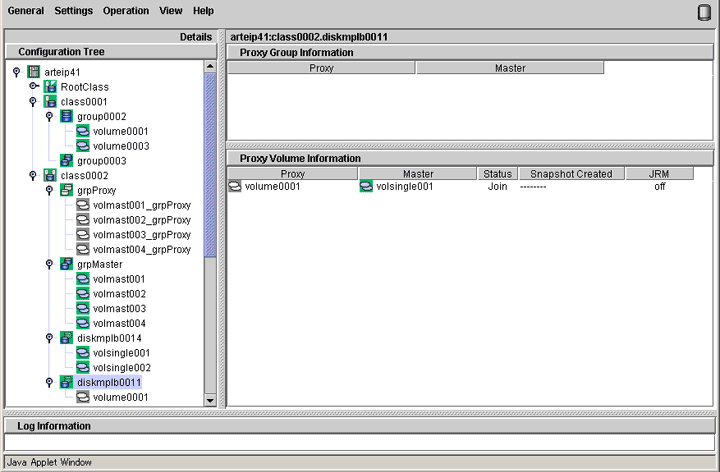
Proxy object configuration related to a volume
Click a volume icon in the GDS Configuration Tree Field to view the following configuration information.
All the master volumes or proxy volumes related to that volume
All the slices within that volume or within volumes related to it
Figure 5.56 Main Screen (for Proxy Objects of a Volume)
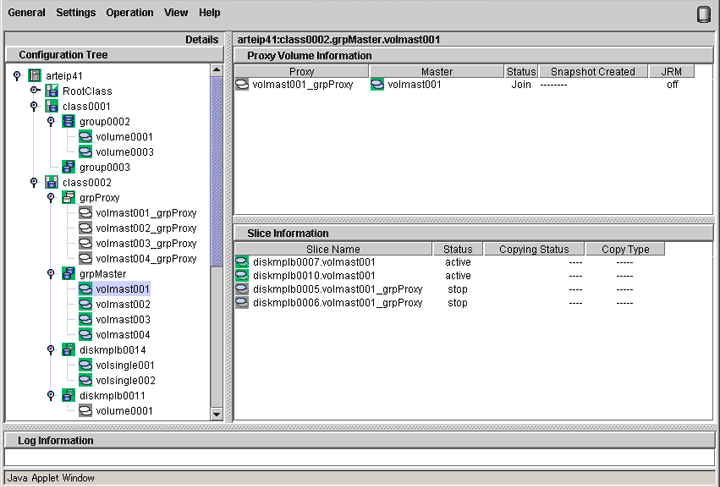
You can monitor the object status from the Main screen.
Object status will be updated at intervals specified in [Change Monitoring Intervals] in the [General] menu. You may also use [Update] in the [View] menu to update the status immediately.
When an abnormality is detected with objects, a warning lamp (yellow/red) will flash.
Clicking the flashing lamp will change the lamp to a lit-up lamp.
See
For details on warning lamps, see "4.1 Screen Configuration."
When the object status changes such as by detection of the failed disk, the icon color and description in the status field will change as well.
See
For details on icons, see "4.3 Icon Types and Object Status."
If a disk unit fails during operation, an icon of the disk in which an error is detected will turn red.
Perform recovery work, following procedures described in "5.3.4 Disk Swap."
Figure 5.57 Object Status Monitoring in Main Screen
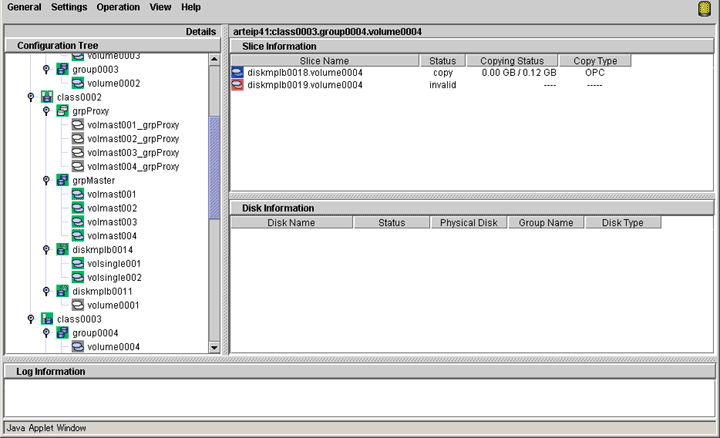
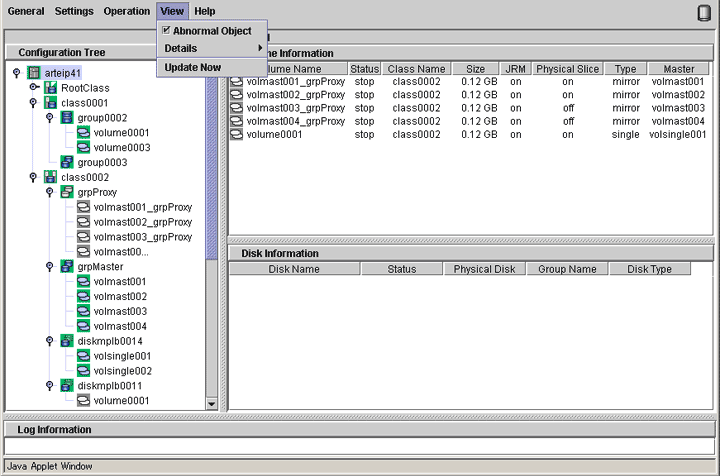
Clicking [Abnormal Object] in the [View] menu will only display objects with abnormalities, making it easy to resolve the problem even when a number of disks are connected.
Figure 5.58 Main Screen when [View]: [Abnormal Object] is selected
Note
Abnormality Detected with GDS Management
What GDS Management displays as abnormal is limited to objects detected by GDS.
Therefore, even if the disk unit may have a hardware abnormality, it will be displayed as normal until it is accessed, and the abnormality is detected.
In the Main Screen, the following two methods are provided for displaying a detailed description of the state of an object and the help to restore the object if it is faulty.
[Check Status] in the popup menu
[Check Status] in the drop-down menu
Information
Object Status Update
The state of objects is updated at regular intervals specified with [General]:[Change Monitoring Intervals]. To check the latest state, select [View]:[Update Now].
See
If the state of an object changes due to a disk failure and so on, the corresponding icon color and status field will change. For status indicator icons, see "4.3 Icon Types and Object Status."
Checking the state of an object
Using one of the following methods, check the state of an object.
[Check Status] in the popup menu
In the Main Screen, right click the desired object and select [Check Status] from the popup menu.
[Check Status] in the drop-down menu
In the Main Screen, click the desired object and select [Operation]:[Check Status].
Object Status Window
View the state of the object in the displayed dialog box.
Figure 5.59 Object Status Window
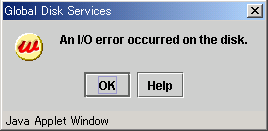
To close the window, click <OK>.
If you see <Help> in the window, click <Help> for a detailed description and the help to restore the object.