Debugging trace is the trace of services of the Management (Master Management) Server. The setting of trace collection is performed on the Management Console that is connected with the Management (Master Management) Server.
Note
Perform debugging trace in specified cases only.
When the data for investigation is collected in large amounts, the load of the PC may be increased. Collect the debugging traces under the instruction of Fujitsu's technical staff.
Trace may not be collected immediately after changing the setting of debug trace.
After changing the settings of debugging trace, it takes almost 6 minutes to activate the new settings.
Settings are immediately activated after you re-start the service of Management Server on changing the settings of debugging trace.
The procedure is as follows.
Start the Management Console window.
Select the Debugging Trace from the Operation Settings menu.
Select Summary or Details.
Click the Settings button.
Approximately 6 minutes after you close the window, collection of Debugging trace will be started.
Trace log files are generated/updated under [OS installation drive]\ProgramData\Fujitsu\Systemwalker Desktop Keeper.
When the file size exceeds 10MB, it will be saved after renaming. (The files with "1" to "3" in the extension will be generated.)
If "3" is contained in the file name of the generated file, no new file will be generated, but the previous file will be overwritten. Therefore, trace logs only require 4 files x 10M. That is, 40M disk capacity at maximum.
When [No] is selected, debugging trace will be stopped.
Note
When the disk space is insufficient, trace will not be collected
When the disk space is insufficient, collection of debugging trace will be aborted automatically.
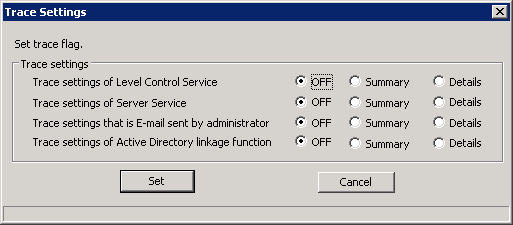
In the following information set using [Trace Settings] of the Server Settings Tool, the collection level of the trace log is the highest setting (the highest level is [Details], and second is [Summary], and the last is [OFF]), which is set in the selection window of [Debugging Trace] of the Management Console.
[Trace Settings of Level Control Service]
[Trace Settings of Server Service]
[Trace Settings of that is E-mail sent by administrator]
In addition, after setting again in the selection window of [Debugging Trace] of the Management Console, this setting will be set to the same level as [Trace Settings] of Server Settings Tool ([Trace Settings of Level Control Service], [Trace Settings of Server Service] and [Trace Settings of that is E-mail sent by administrator]

Item Name | Description |
|---|---|
[Trace Settings of Level Control Service] | Set the trace specification of level control service.
|
[Trace Settings of Server Service] | Set the trace specification of server service.
|
[Trace Settings that is E-mail sent by administrator] | Set the trace specification of administrator notification function
|
For [Trace Settings of Active Directory linkage function], refer to "5.4 Collect Trace of Active Directory Linkage Function ".