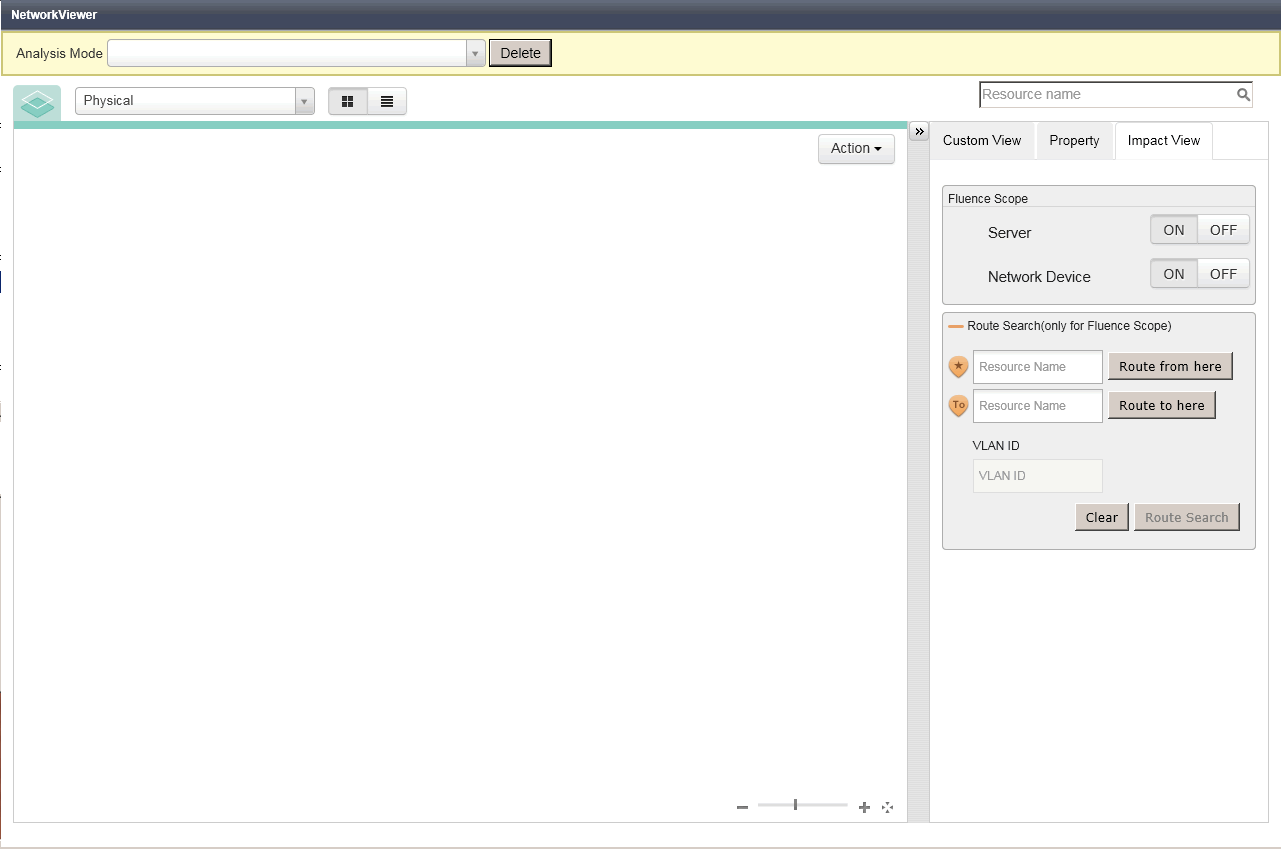
This section explains how to operate the [Analysis Mode] window.
The [Analysis Mode] window is displayed when one of the following operations is performed:
The [Action] button in the network view is clicked. Then [Analysis Mode]-[Open] is selected from the list of actions.
The [Analysis Mode] button on the Toolbar is clicked.
Figure 11.25 [Analysis Mode] Window
Information
When there is no influence scope data that has been saved, the [Analysis Mode] window is not displayed. Instead, the [Analysis Mode - Save Current Status] window is displayed.
Save one or more sets of influence scope data, referring to "11.3.11.1 Saving Influence Scope Data".
Use the following procedure to display influence scope data.
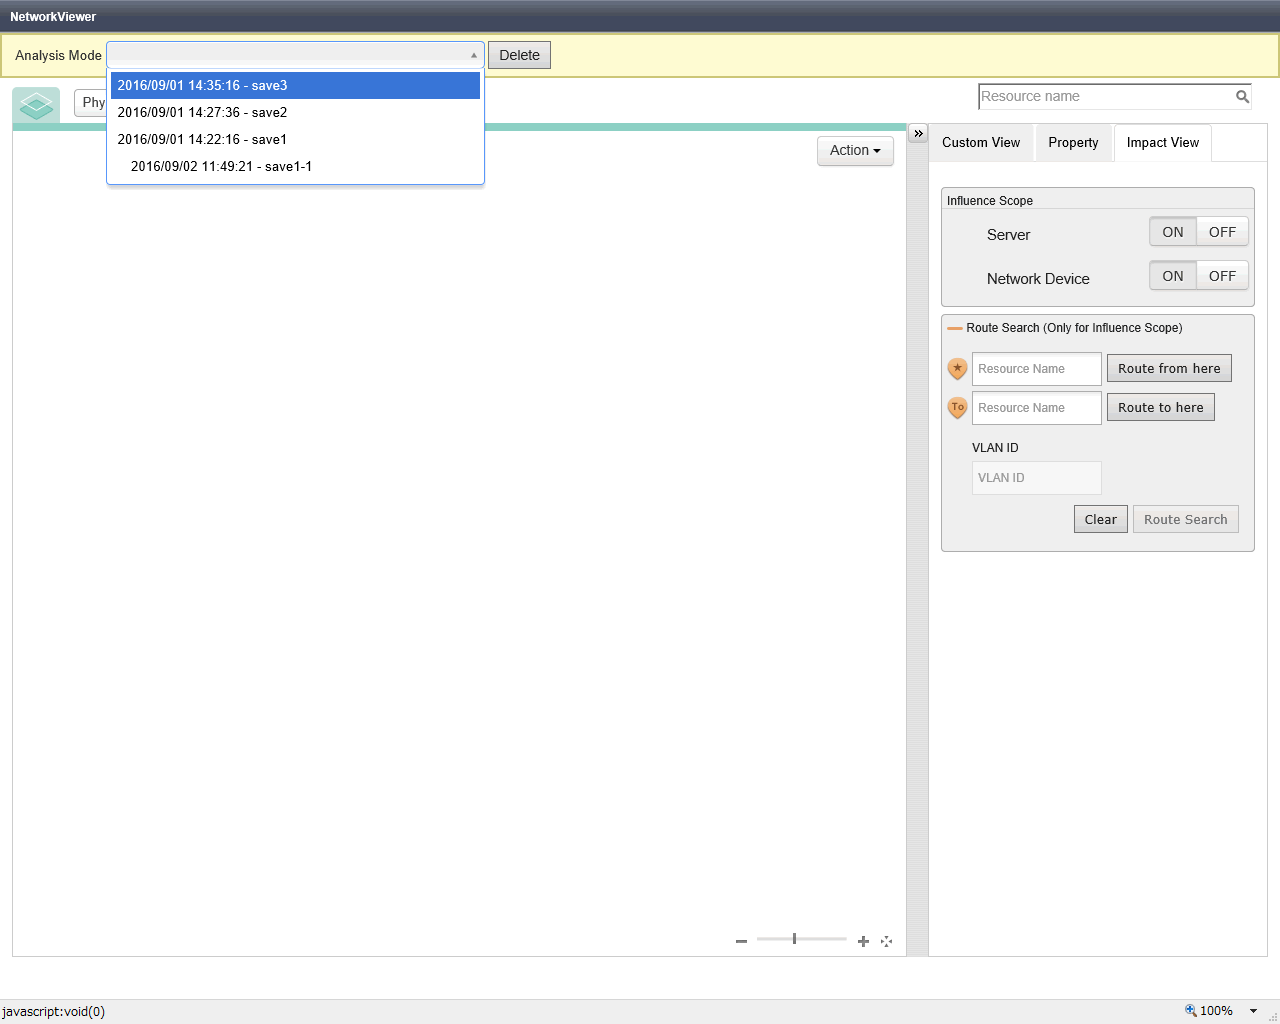
In the pull-down menu at top of the [Analysis Mode] window, the list of influence scope data saved by the logged-in user is displayed.
Figure 11.26 Influence Scope Data List
Point
Modified failure state data that was saved using the Change Resource Status function is displayed indented under the original influence scope data.
For the change resource status function, refer to "11.3.12.4 Change Resource Status".
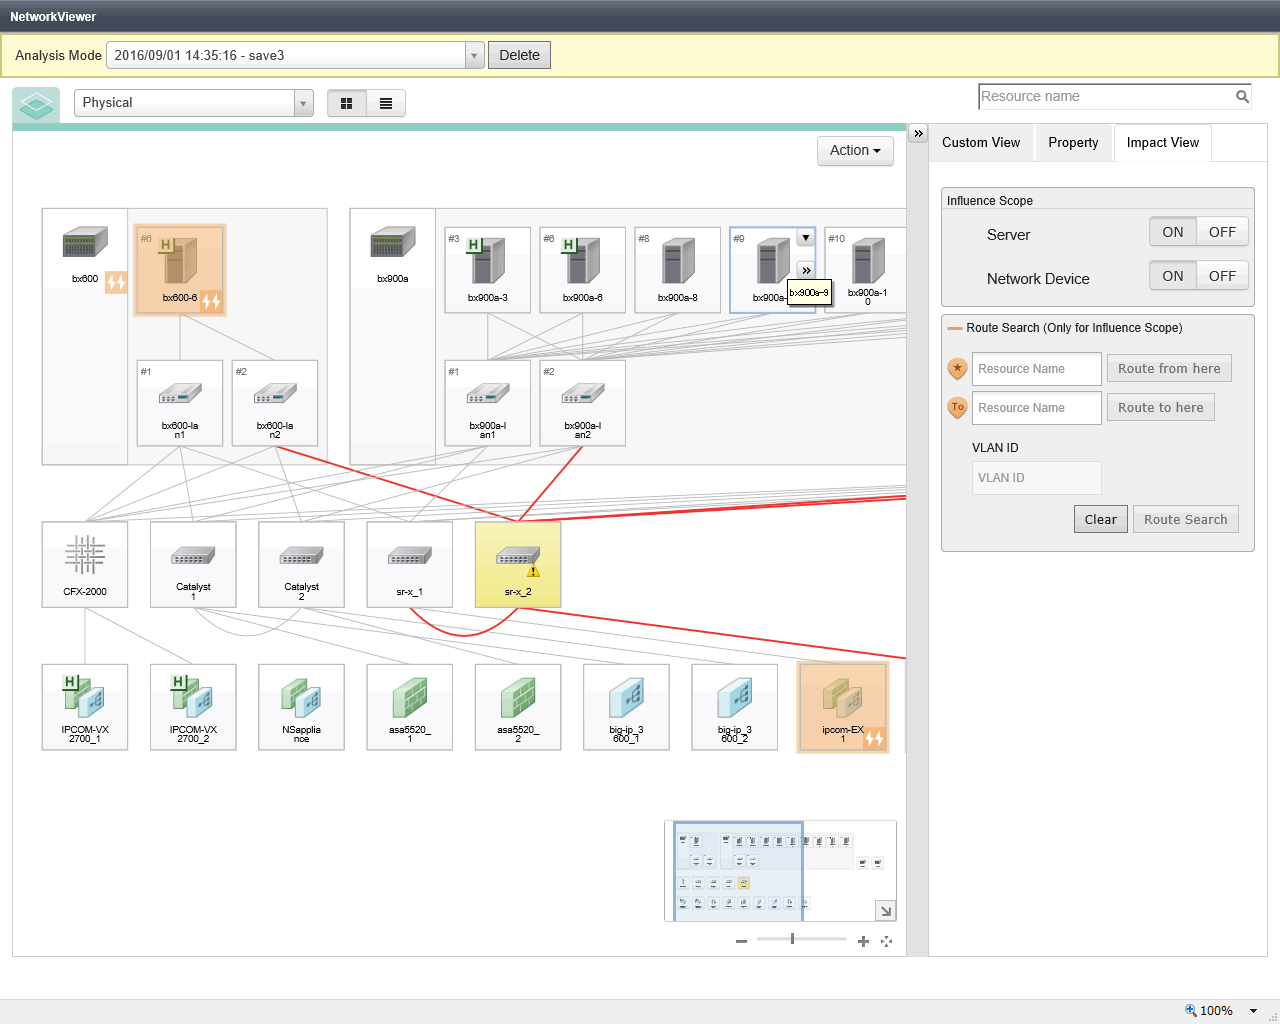
Select influence scope data from the pull-down list.
A map view of the influence scope data is displayed in the network view.
Figure 11.27 Map View of the Selected Influence Scope Data
This section explains the Impact View of the utility panel.
This view provides two boxes: [Influence Scope] and [Route Search (Only for Influence Scope)].
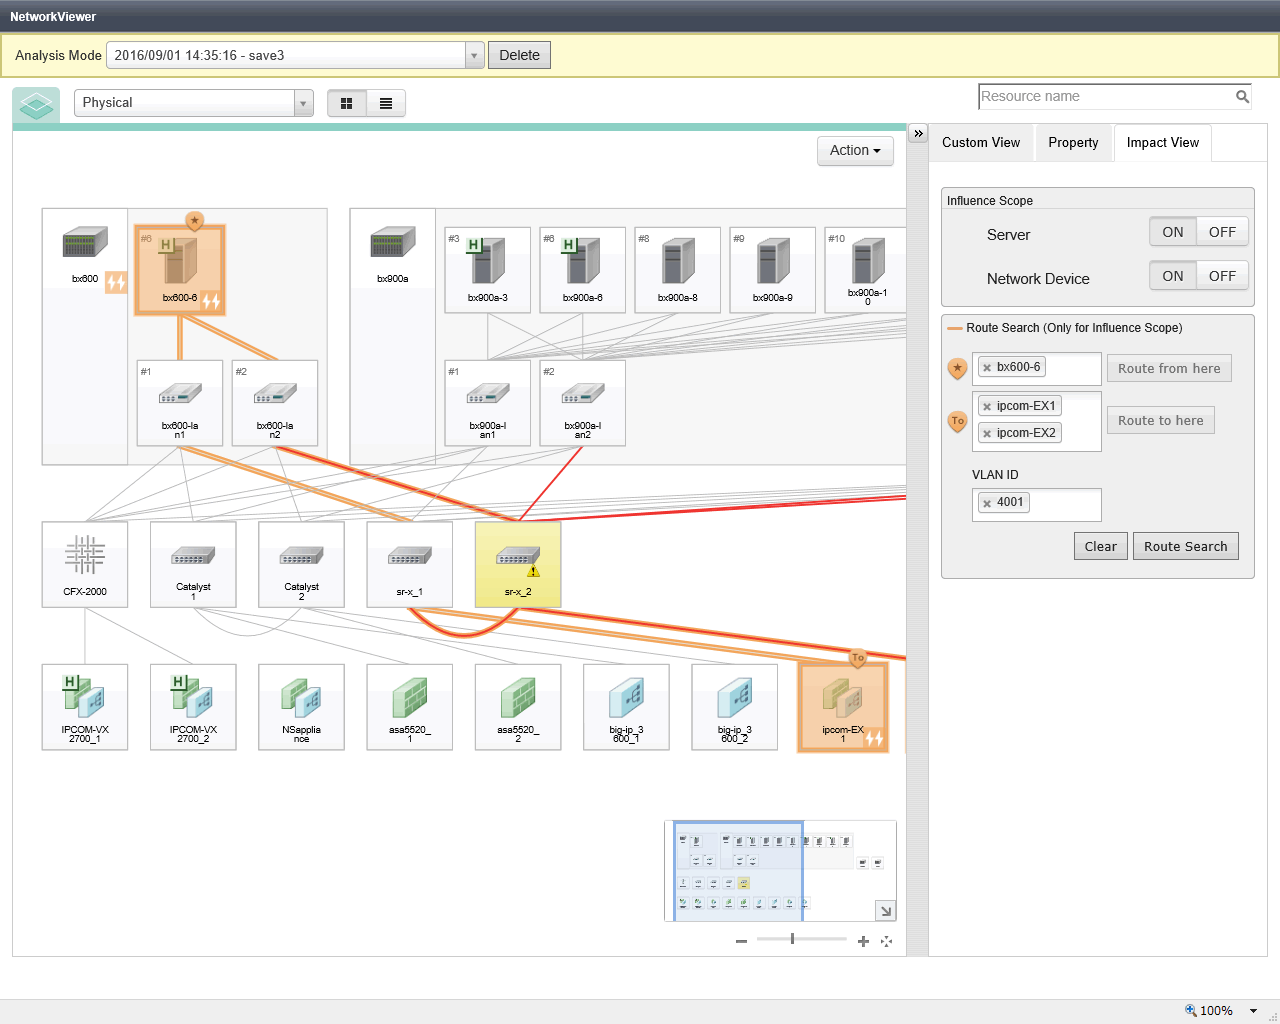
Figure 11.28 Display of Routes in the Influence Scope
Influence Scope
Items to display in the influence scope can be selected from the following:
Servers
Network devices
By default both servers and network devices are "ON".
Route Search (Only for Influence Scope)
This function displays (in orange) the routes included in the scope affected by the device failure among the routes displayed in the network view.
The following resources can be set for the start and end points of routes.
Servers
VM hosts
Firewalls
SLBs
Integrated network devices
Point
Only one resource can be selected for the start point (![]() ), while multiple resources can be selected for the end point (
), while multiple resources can be selected for the end point (![]() ).
).
Note
Select the resource to use as the start or end point of the route in advance, and display it in the network view.
If the resource that is to be the start or end point of the route is not displayed in the network view, the [![]() ] icon or the [
] icon or the [![]() ] icon will not be displayed on the relevant resource.
] icon will not be displayed on the relevant resource.
In that case, clear the route of the influence scope. Then, with the resources that are to be the start and end points of the route displayed in the network view, set the start and end points of the route again.
The routes within the scope affected by the device failure can be displayed by performing the following procedure:
Select the resource to be the start point of the route.
Select a resource icon displayed in the network view.
Click [Route from here] in the [Route Search (Only for Influence Scope)] box.
Click the input box next to the [![]() ] icon in the [Route Search (Only for Influence Scope)] box.
] icon in the [Route Search (Only for Influence Scope)] box.
Select a resource from the list of candidates for the start point which is displayed in the pull-down.
The [![]() ] icon is appended to the resource icon selected as the start point.
] icon is appended to the resource icon selected as the start point.
In addition, a gray [To] icon is appended to the resource icons which are the candidates of the end point.
Select a resource for the end point of the route.
Select a resource icon with the gray [To] icon which is displayed in the network view.
Click [Route to here] in the [Route Search (Only for Influence Scope)] box.
Click the input box next to the [![]() ] icon in the [Route Search (Only for Influence Scope)] box.
] icon in the [Route Search (Only for Influence Scope)] box.
Select a resource from the list of candidates for the end point which is displayed in the pull-down.
The color of the [To] icon appended to the resource icon selected as the end point changes from gray to orange.
Point
When selecting multiple end points, repeat this procedure.
To display the affected scope for only a particular VLAN, specify the VLAN ID in [VLAN ID].
When no VLAN ID is specified, the affected scope for all VLANs is displayed.
Click [Route Search] in the [Route Search (Only for Influence Scope)] box.
The routes within the scope affected by the device failure are displayed in orange.
This section explains the Change Resource Status function for influence scope data.
This function changes the statuses of resources displayed in the network view and saves the modified failure state data. This enables you to confirm the affected scope when trouble occurs on a particular resource, using the [Analysis Mode] window.
The [Change Resource Status] window can be displayed by performing the following operations.
Click the [Action] button on the [Analysis Mode] window.
Select [Change Resource Status] from the list of actions.
Figure 11.29 [Change Resource Status] Window
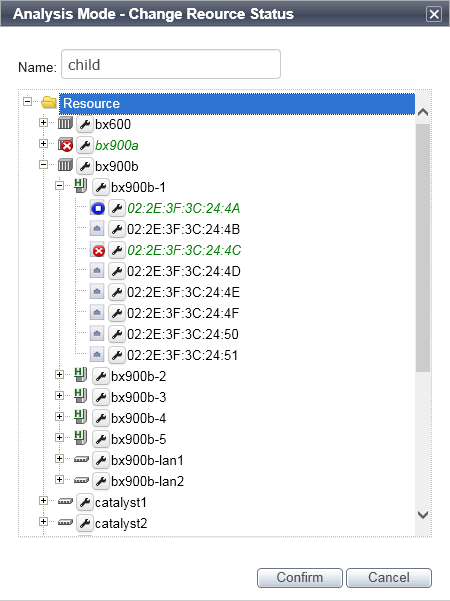
Specify the name of the modified failure state data with the changed resource status.
Resources displayed in the network view are displayed in a tree format.
An icon indicating the resource type is displayed.
When the resource status is something other than [normal], the icon representing the resource status is allocated.
When the cursor is hovered over the icon, a tooltip providing the following information is displayed.
IP address
Device name
Location
When the resource does not have the above information, a hyphen ("-") is displayed.
Clicking the configuration button (the spanner icon) displays the following configuration menus.
Figure 11.30 The "Change Status" Menu

Set one of the following statuses as the resource status:
normal
stop
error
In Analysis Mode, when the status of a resource is one of the following, it is handled as [error].
warning
unknown
fatal
Therefore, when using the Change Resource Status function, specify these statuses instead of [error].
Note
As [stop] indicates a normal stoppage, the influence scope for resources with the [stop] status is not displayed.
In order to display the influence scope when devices have been stopped for maintenance, specify [error].
Point
The asterisk ("*") appended to the beginning of a state name indicates that the corresponding status is set for the resource.
"(default)" appended to the end of a state name indicates that the corresponding status is the status prior to changing of the resource status.
However, "(default)" is not displayed if the resource status before change is one of the following:
warning
unknown
fatal
The name of the resource is displayed.
When the cursor is hovered over the icon, a tooltip providing the following information is displayed.
IP address
Device name
Location
When the resource does not have the above information, a hyphen ("-") is displayed.
Point
Resource names for which the resource status is being changed are displayed in green and italics.
Confirm the content of changes to resource statuses.
Figure 11.31 Confirmation Window
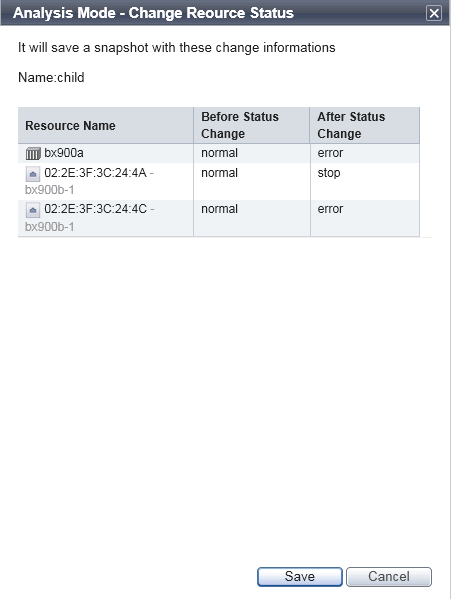
When the [Save] button is clicked, the influence scope data with changed resource statuses is saved as modified failure state data.
Point
Up to five sets of modified failure state data can be saved.
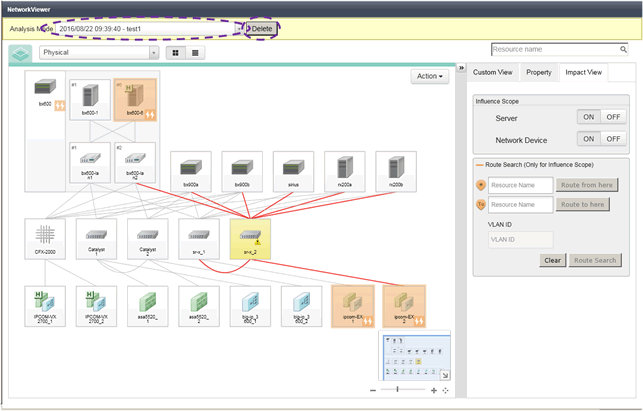
Use the following procedure to delete influence scope data.
Select the influence scope data in the [Analysis Mode] window.
Click the [Delete] button.
The [Delete Influence Scope Data] window is displayed.
Click the [OK] button.
The influence scope data is deleted.
When influence scope data contains modified failure state data, the modified failure state data is also deleted.
Figure 11.32 Deleting Influence Scope Data and Modified Failure State Data
Point
Modified failure state data can be deleted using the same procedure.