The PowerCOBOL Debugger provides multiple options for executing an application. You may execute a single statement at a time, an entire procedure in a step, execute multiple sections or procedures stopping on breakpoints, or simply execute the entire application without viewing any source code.
Making good use of breakpoints will help you balance the overall application debugging view that you desire.
When you start the Debugger, your application is loaded and prepared for execution. Actual application execution does not begin, however, until you instruct the Debugger to start.
This initial pause in the application's execution startup allows you to set any initial breakpoints or to select data items to monitor (watch) during execution.
Once you are ready to begin execution, you can either select Step Into or Go from the Debug menu.
The Step Into option initiates the application and will display the PowerCOBOL Run-time Environment Setup window. Once you click on the OK button in this window, you will be positioned on the first execution statement prior to the main form (window) being displayed. If you did not write any event procedures to execute before the main form is displayed, you will be presented with the main form. When you perform an action on the main form that generates an event for which you have created an event procedure, you will then be positioned at the first line of that event's execution code, and execution will be paused.
The Go option will begin executing your application without displaying any of its source code until it encounters a breakpoint, or until the GUI requires user interaction.
Unless you have created one or more event procedures to execute before your application's main form (window) is to be displayed, you should first see the main form on the screen.
If you have instead specified an event procedure to be invoked prior to the main form being displayed (for example, maybe you need to read a data file to populate fields on the main form before it is displayed), the Debugger will display your event procedure code.
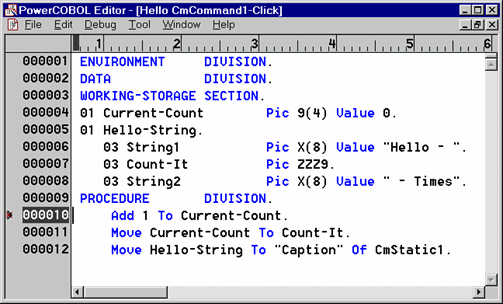
Whenever the Debugger presents you with any of your application source code, it will do by displaying it in a live Editor window as shown in the following example:
Figure 7.12 A live Editor window invoked by the Debugger
Within this window, you may control execution, set and delete breakpoints, select data items to be monitored (watched), and even make source code corrections. Source code corrections will not take effect until you quit the debug session and rebuild the application.
Whenever an Editor window is opened up for an event procedure, the line of procedure code about to be executed next with be designated with a ">" to the left of its sequence number.
As you step through execution statements, the ">" will move to the next execution statement to show you where you are currently positioned in the logic flow of your source code.
If you set a breakpoint on a line of code, it will be denoted by an "*" to the left of that line of code's sequence number.
One of the features of the PowerCOBOL Debugger is its support of opening multiple live Editor windows containing multiple event procedures. This allows you to examine source code and current data item values in sections of your application that may not currently be executing.
Once you have stepped into an event procedure and are looking at the source code in the editor window, you have four options in the Debug menu to control the next step in execution:
Step Into - this option will execute the next statement. If this statement causes a branch in the logic of your application (such as a CALL to another program, or a PERFORM on another paragraph), you will be branched in the logic to the next physical execution statement. Execution will be paused on this next execution statement. Use this option when you want to ensure that you step through the exact flow of logic.
Step Over - this option will execute the next statement. If this statement causes a branch in the logic of your application (such as a CALL to another program, or a PERFORM on another paragraph), you will not be branched. Instead, all of the statements in the called program or performed paragraph will be executed as a single step. You will then be positioned in the current event procedure on the next physical execution statement following the CALL or PERFORM that was just executed.
Run To Cursor - this option will execute up to the line you position the cursor on.
Run to Exit - this option will perform all of the statements in the current event procedure instantly (including any called programs or performed paragraphs) up to the last statement in the current event procedure. Execution will then be paused on the final execution statement without executing it. This allows you to examine the state of the current event procedure before it is exited.
Go - this option causes execution to start immediately and proceed until a breakpoint is encountered or you select Break from the Debug menu. The application will execute as if it is running normally at machine speed.
You may use these different options under various conditions to enhance your debugging productivity.
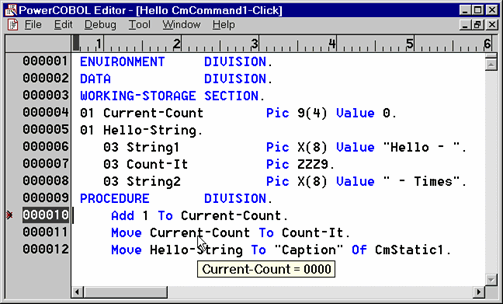
After you have begun execution under the debugger and you are currently stopped in execution in an editor window, you can use a very handy feature to examine the contents of any initialized data item.
To do this, simply hover the mouse pointer over the data item you wish to examine and its current value will pop up in a small window such as in the figure below:
Figure 7.13 Hovering over a data item to display its current value