You can use the diagnostic function when the application abends or outputs an error messages. The diagnostic information reports the module name, form name, event procedure name, line number and other useful information. PowerCOBOL utilizes the COBOL diagnostic function; so refer to the "COBOL Debugging Guide" for details.
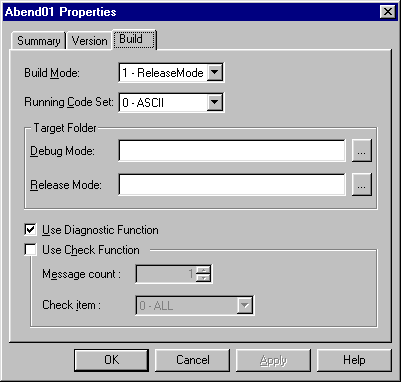
The diagnostic function is automatically switched on whenever you build a module in debug mode. You may optionally select the diagnostic function in a release mode module by clicking the appropriate checkbox in the project's Properties Build tab as shown below:
Figure 7.14 Turning on the Diagnostic Function

Check "Use Diagnostic Function" in the "Build" tab of the project Properties dialog.
The size of the debug information file (FormName.SVD) is smaller if the "OPTIMIZE" compile option is specified.
Note that, in Release mode, you must move or copy the debug information files (*.SVD and *.PLE) to the folder in which the executable file exists if you move or copy the executable file to another folder.
When you select Debug mode, "Use Diagnostic Function" is checked automatically.
If you are using programs from multiple projects, set the folder name, in which the debug information files (*.SVD and *.PLE) of the other modules reside, in the "Debug information file folder" field in the "Debug" tab of the module Properties dialog.
Note that, you cannot use the diagnostic function effectively if you move or copy the executable files to another folder, or you do not execute within the PowerCOBOL development environment, because PowerCOBOL cannot find the debug information files.
The .pli file that is output in the folder contains information about the event procedure lines (PowerCOBOL Line Information). If you remove this file, PowerCOBOL outputs only the COBOL level information - not the event procedure line information.
PowerCOBOL outputs the following files to support the provision of diagnostic information:
Information file | File type | Output folder (Release mode) | Output folder (Debug mode) |
|---|---|---|---|
COBOL Debugging information file | SVD | Target folder | Working folder |
PowerCOBOL line information file | PLI | Target folder | Target folder |
If you specify the compile option "OPTIMIZE", the size of the .svd file becomes smaller, and you cannot debug the project in debug mode.
PowerCOBOL outputs information (lines shaded with text in bold) to this part of the report:
...

<<Detail>>
  Thread ID : FFE8BC61
  Register  : EAX=00000000  EBX=0085F814  ECX=00000000  EDX=00000000 ESI=0085F7D8
            : EDI=0085F8FC  EIP=00401377  ESP=0085F778  EBP=0085F8C4 EFL=00010283
            : CS=0167  SS=016F  DS=016F  ES=016F  FS=12AF  GS=0000
  Stack Commit : 00005000 (Top:00860000, Base:0085B000)
  Instruction  : Address  +0 +1 +2 +3 +4 +5 +6 +7 +8 +9 +a +b +c +d +e +f
                 00401367 00 0F BF 05 42 60 40 00 99 0F BF 0D 3A 60 40 00
         FAULT ->00401377 F7 F9 66 89 45 DA 0F BF 45 DA B1 04 B5 00 8D 3D

  Module File : C:\SAMPLES\RELEASE\MAIN.EXE
  Section Relative Position : .text+00000377
  Export Relative Position : MAINFORM+00000343
  Symbol Relative Position : MAINFORM+00000377
  Compilation Information : ASCII, SINGLE THREAD, NOOPTIMIZE
  PowerCOBOL Project File : C:\Samples\Abend01.ppj
  Module : Main
  Form : MainForm
  Scriptlet : MainForm-Click
  Line : 8

 <Call Stack>
[  1]----------------------------------------------------------------------------
  Module File : C:\SAMPLES\RELEASE\MAIN.EXE
  Section Relative Position : .text+000001F8
  Export Relative Position : MAINFORM+000001C4
  Symbol Relative Position : MAINFORM+000001F8
  Compilation Information : ASCII, SINGLE THREAD, NOOPTIMIZE
  External Program/Class : MAINFORM
  Source File : MainForm.PRC
  Source Line : 35

...
When "Use Diagnostic Function" is checked in the Build tab of the project Properties dialog, PowerCOBOL adds the following information to the report. Refer to the "COBOL Debugging Guide" for an explanation of the standard information contained in the file.
Provides the name of the PowerCOBOL project file containing the module that raised the application error. If the PowerCOBOL line information file cannot be found, "Unknown" is inserted.
Provides the name of the module that raised the application error.
Provides the name of the form that raised the application error.
Provides the scriptlet name that raised the application error.
Provides the line number that raised the application error. This is the line number within an event procedure or the relative line in an included COBOL file.
Information | Break point | Diagnostic report | Notes | ||||
Event procedure | External COBOL file | Form's common program | Without Power-COBOL line information file | Without COBOL debugging information file | Without both information files | ||
Module File | OK | OK | OK | OK | OK | OK | |
Section Position | OK | OK | OK | OK | OK | OK | |
EXPORT Position | OK | OK | OK | OK | OK | *1 | |
Symbol Position | OK | OK | OK | OK | OK | *1 | |
Compilation Information | OK | OK | OK | OK | OK | *1 | |
PowerCOBOL Project File | OK | OK | OK | *2 | - | - | Specific to PowerCOBOL |
Module | OK | OK | OK | - | - | - | Specific to PowerCOBOL |
Form | OK | - | OK | - | - | - | Specific to PowerCOBOL |
Scriptlet | OK | - | - | - | - | - | Specific to PowerCOBOL |
Line | OK | OK | OK | - | - | - | Specific to PowerCOBOL |
External Program / Class | - | OK | - | OK | - | - | |
Internal Program / Method | - | OK | - | OK | - | - | |
Source File | - | - | - | OK | - | - | |
Source Line (COBOL) | - | - | - | OK | - | - | |
*1) For this information you need to specify the link option, /DEBUG
*2) This information becomes "Unknown".