This section guides you through a number of the key debugging functions.
A. Preparing for Debugging
Programs are prepared for debugging by compiling with the TEST compiler option.
When you set this compiler option within Project Manager the appropriate linker options are set automatically. The Project Manager has a “Build for Debugging” option on the Project, Option sub-menu that sets all the appropriate compiler and linker options for you.
In Project Manager compiler and linker options are set at the project level - so all files within a project are compiled with the same options.
Check that Sample05 is being built for debugging:
From the Project menu select, Option and check that “Build for Debugging” is checked.
If it is not checked, click on the menu item.
If it is checked click on a blank area of the Project Manager window to close the menu.
From the Project menu select Build.
Project Manager builds the project using the newly set compiler and linker options.
Note that if you didn’t have to check the “Build for Debugging” option, so that nothing has changed since the previous build, the builder simply displays the messages “Build Start” and “Build End” indicating that there was nothing to do.
The project is now ready for debugging.
B. Invoking the Debugger
To invoke the debugger:
Select SAMPLE05.PRJ in the project tree.
From the Project menu select Debug.
The COBOL Debugger starts and displays the Start Debugging dialog.
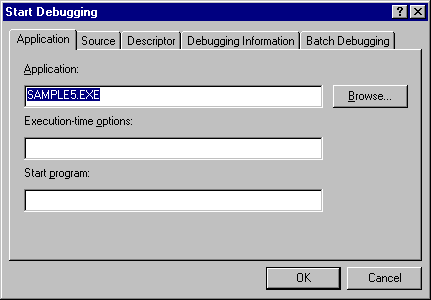
This dialog gives you the opportunity to specify information that may affect your debugging session, such as: the locations of various source and system files, the option to have the debugging session driven by a command file, and even which program you first want to see in the debugger. Although the defaults will work for you most of the time, the ability to configure this information at start-up is invaluable in certain situations, such as debugging with other languages. (See "Debugging with Visual Basic" below).
For this debugging session you do not need to specify any extra information so click OK.
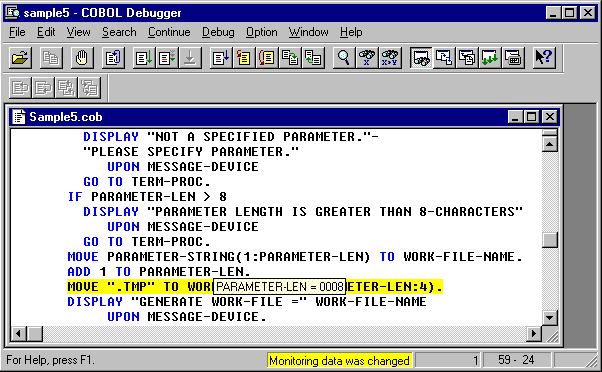
The COBOL Debugger displays Sample5.cob. It highlights the first executable line in the procedure division.
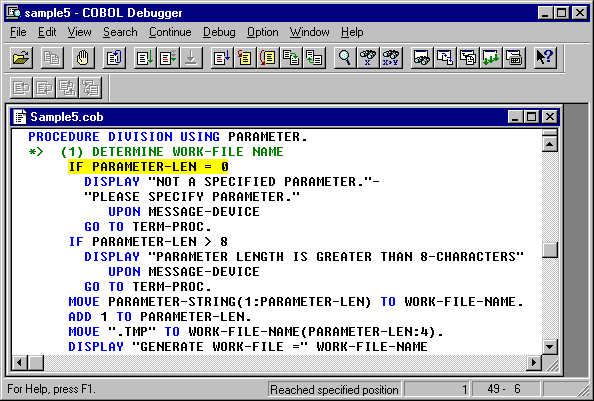
Notice that code readability is aided by coloring the source code.
You may want to open a number of windows in the debugger so maximize the debugger window by clicking on the maximize button, at the top right of the window.
Widen the source display window by dragging the border.
You are now ready to explore the program using the debugging features.
Sections C to F give general descriptions of the functions available with pointers to where these functions can be found. You can experiment with the functions that are of most interest to you.
Some powerful features you may want to check are:
The "Specific Execution" execution control function. (In section C)
Break on change of data. (In section D)
Datatips. (In section E)
Tracing the execution path. (In section F)
C. Controlling Execution
Location
The execution control functions are located on the Continue menu, and a number of them are available on the toolbar:
![]()
Hover the mouse pointer over a button to display a tooltip confirming the function of the button.
Description
Re-debug:
![]()
Restarts the program debugging session with re-initialized data. Gives the option of clearing or retaining breakpoints, watch data, and passage counts.
Go:
![]()
Runs the program to the next breakpoint, break condition, or the end whichever comes first.
Animate:
![]()
Executes the program line by line at a configurable speed.
Break:
![]()
Interrupts execution when the program is running or being animated.
Change Start Point to Cursor: (not on toolbar)
Makes the statement containing the cursor the next statement to be executed. (If disabled try stepping one statement.)
Run to Cursor:
![]()
Runs the program up to the statement containing the cursor.
Step Into:
![]()
Executes one statement. If the statement transfers control to another debuggable program the debugger takes you into that program.
Step Over:
![]()
Executes one statement and stops on the next statement in the current program, regardless of whether the current statement transfers control to another debuggable program.
Step Out:
![]()
Runs the current program, interrupting execution when control passes to the calling (debuggable) program.
Run to Next Program:
![]()
Runs the current program, interrupting execution when control passes to another debuggable program.
Specific Execution: (not on toolbar)
Runs the program up to the next point specified in the Specific Execution Condition.
Specific Execution Condition: (not on toolbar)
Displays a dialog from which you can select a condition for interrupting program execution. Options include stopping at any of 52 verbs, stopping at a specified line number, stopping at the entry or exit of a named program, and stopping where a named file is accessed.
D. Breaking Execution
In addition to specifying points to which execution should run in the execution control functions, there are three other ways of breaking execution:
Setting breakpoints
Breaking on change of data
Breaking on satisfaction of a specified condition
Breakpoints
To set a simple breakpoint - right click on the line to contain the breakpoint and select "Set Breakpoint" from the pop-up menu.
To set a more complex breakpoint, select Breakpoint from the Debug menu.
You can specify that execution should only be interrupted at the line if a condition is also satisfied, or if the line has been executed a particular number of times. You can also maintain a list of breakpoints enabling and disabling them depending on your debugging situation.
Break on Change of Data
To have the debugger interrupt execution when the value of a data item changes:
Right-click on the data item name, anywhere that it occurs in the text, and select Add Watch Data from the pop-up menu.
The debugger displays the Add Watch Data dialog with the data and program name fields already filled in:
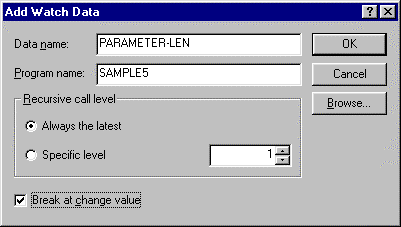
Select any options you require, such as “Break at change of value” and click OK.
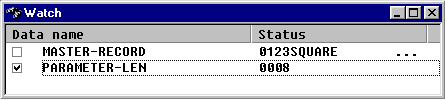
The item is added to the Watch window - shown below with two items:
MASTER-RECORD and PARAMETER-LEN.
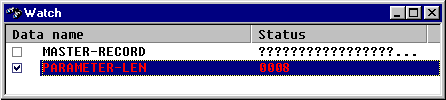
The check box indicates that any change in PARAMETER-LEN causes a break in execution - the red colored text indicates a break on change of value has just occurred.
The queries in the MASTER-RECORD entry indicate non-character values (in this case LOW-VALUES as the record has not yet been read).
The “…” in the MASTER-RECORD entry indicates there is more data than displayed in the window.
You can check and uncheck the checkboxes in the Watch window to monitor different items for changes.
Break on Condition
To have the debugger interrupt execution when a particular condition is satisfied:
From the Debug menu, select Add Watch Conditional Expression.
The debugger displays the Add Watch Conditional Expression dialog with any word that was pointed at entered in the “Conditional expression” field.
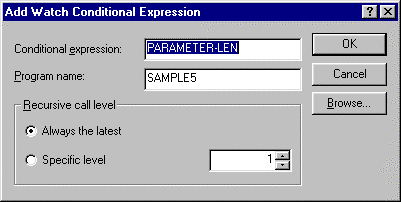
Enter a conditional expression in the entry field. (e.g. PARAMETER-LEN>9).
Note: The Browse function lets you enter the name of a record or group item, then select data items from within that record.
Click the OK button.
The debugger adds the condition to the Watch window:
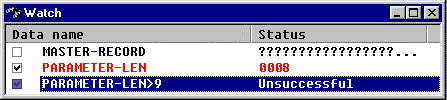
It then monitors the condition and interrupts execution when the condition is satisfied.
E. Monitoring and Changing Data Values
You can monitor data values by using Datatips or the Watch Data window.
You can change data using the Debug - Data dialog, or the Watch Data window.
Datatips
You can check the value of a data item very quickly by using the datatip feature. Just hover the mouse pointer over the data item name anywhere in the text, and the debugger displays the value.
Watch Data Window
The Watch Data window displays a list of items with their values.
To add an item to the Watch Data window, right click on the item name, and select "Add Watch Data" from the pop-up menu.
Alternatively display the Data dialog, enter the data name and click on the Watch button.
To edit an item in the Watch Data window, just click on the value and enter the new value.
Debug, Data Dialog
The Debug, Data dialog lets you:
Enter a data name, including names of items in any loaded program.
For recursive programs you can specify the call level at which to view the data item.
View the value of the item in character or hexadecimal formats.
Edit the value.
Add the item to the Watch Data window.
To display the Debug, Data dialog select Data from the Debug menu.
F. Tracing the Execution Path
The debugger can record the execution path so that you can check how execution reached a particular point.
To start the debugger recording the execution path select Trace from the Debug menu.
You can then run the code to a breakpoint or to the point at which a condition is satisfied.
The Backward Trace functions (Previous Statement , Next Statement , Previous Procedure , Next Procedure ) help you explore the route that execution took to reach that point.
Use View, Toolbars, to display the Backward Trace toolbar.
G. Using the Recording and Playback Functions.
The debugger lets you record complete debugging sessions or parts of debugging sections. This can let you automate repetitive tasks or testing procedures.
The following instructions record and playback a very simple sequence but they demonstrate the principles required to set up much more complex debug recordings.
We will record some steps, and play the recorded file while recording a new file.
If you have been debugging using Sample5, select Continue, Redebug to initialize the debugging session. If you have not been debugging Sample5 start the debugger with Sample5.
From the Option menu select Output Log.
The debugger displays the Output Log dialog:
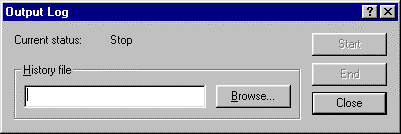
The History file is the file to which the debugger writes a record of the operations performed with the results of those operations.
Enter "Recording1" for the name of the history file.
Click on the Start button to start recording.
Click on the Close button to close the Output Log dialog window.
Click on the Step Into button, two times to execute two statements.
Right click on the data name "WORK-FILE-NAME" and select Data from the popup menu.
The debugger displays the Data dialog.
There is nothing in WORK-FILE-NAME - it is all spaces (which you can check by switching to Hexadecimal - an ASCII space is "20" in hex).
Click on the Output Log button in the Data dialog.
The debugger writes information about WORK-FILE-NAME to the log file.
Click on the Close button to close the Data dialog.
From the Option menu, select Output Log, and click on the End button.
This stops the debugger logging each operation.
Click on the Close button to close the Output Log dialog.
So, to recap, you have recorded stepping two statements, and checking the value of WORK-FILE-NAME.
Now open the Recording1.log file by starting Windows Explorer (right click on the Start button in the Windows task bar, and select Explore from the pop-up menu) and navigating to the folder:
C:\Program Files\Fujitsu NetCOBOL for Windows\Samples\cobol\Sample05
Then double click on the file "Recording1.log" to bring up the file in the COBOL Editor.
Your recording should look something like this:
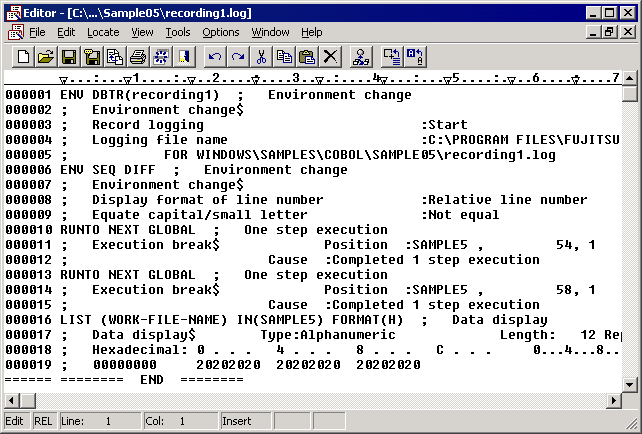
Notice that the log file consists essentially of two types of lines - debug commands or operations (ENV, RUNTO, LIST), and comment lines starting with ";". The comments describe the commands and display results of the commands. Because the results are output as comments you can use the log file as input to the debugger - it ignores the comments and executes the commands.
So now we will execute the log file.
Close the Editor and return to the debugger by selecting "sample5 - COBOL Debugger" from the Windows task bar.
Start another output log by selecting Option, Output Log from the menu bar, and entering "Recording2" as the History file name. Click on the Start button, then Close the Output Log window.
By writing an output log when playing back debugger commands you can later inspect the results of those commands.
From the Option menu select Automatic Debugging.
The debugger displays the Automatic Debugging dialog.
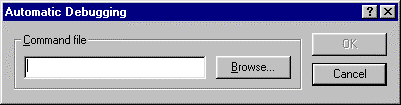
The command file is any file containing debug commands. We will use the first log file we created.
Click on the Browse button to display a list of available command files.
The debugger displays all files with a .log extension.
If necessary navigate to the folder containing your log file.
Select Recording1.log and click on Open.
You return to the Automatic Debugging dialog with the file name in the Command file entry field.
Click on OK to run the command file.
The debugger displays an information message that it is ignoring the DBTR option in the command file. (The ENV, DBTR option starts history files, and is not supported when running command files - we'd normally edit the log file to remove this option.)
Respond OK to the message.
The debugger executes the commands in the Recording1.log file (two steps and one check of data item contents).
Stop writing to the Recording2 output log by selecting Option, Output Log from the menu bar, and clicking on End.
Now open the Recording2.log file by returning to Windows Explorer (select Exploring from the Windows task bar) and double clicking on the Recording2.log file to bring it up in the COBOL Editor.
Your recording should look like this:
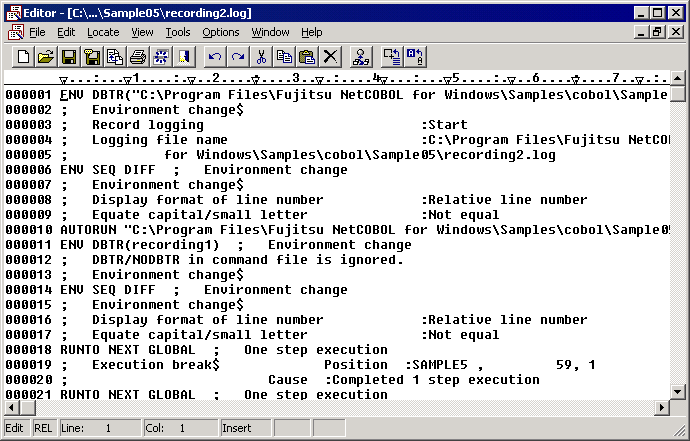
This has a couple of differences from Recording1.log:
First it shows the Recording1.log file being run (the AUTORUN command).
Second, the results of each of the commands (RUNTO, and LIST) are different because the commands were executed at a different point in the program.
You can see how, in a few steps, long or highly repetitive debug operations can be automated using the logging (recording) and automatic debugging (playback) features.
The full set of debug commands is documented in the debugger help system in the Reference, Line Commands section. This provides you with the option of coding sequences of debug commands using a text editor, or of generating command sequences automatically.
H. Debugging with Visual Basic
NetCOBOL is designed to work well with other languages. A good demonstration of this ability is to see the COBOL and Visual Basic debuggers working side by side. The following steps take you through a simple program made up of Visual Basic code calling a COBOL DLL. They give you all the information necessary to set up a dual language debugging session.
The example assumes that you have Microsoft Visual Basic 5.0 or later installed.
Setup the Environment Variable to Invoke the Debugger
Because, in this example, Visual Basic is going to be calling COBOL, you need to ensure that an environment variable (@CBR_ATTACH_TOOL) is set so that the COBOL Debugger is started when the COBOL code is invoked.
From COBOL Project Manager’s Tools menu select “Run-time Environment Setup Tool”.
Open the file COBOL85.CBR in the Sample13 folder. If it doesn’t exist, create it by navigating to the folder and entering “COBOL85.CBR” as the file to open.
Select the Section tab.
Select SAMPLE13 from the Section drop-down list.
If there is nothing in the list enter “SAMPLE13”.
If @CBR_ATTACH_TOOL=TEST is not displayed in the Section list box:
Select @CBR_ATTACH_TOOL from the Variable Name drop-down list.
Enter “TEST” into the Variable Value field.
Click on Set to add the variable to the section list.
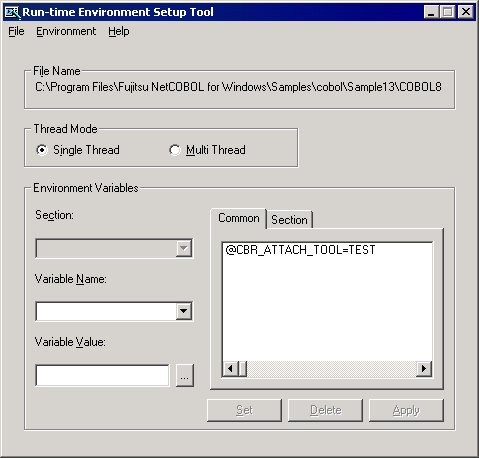
Click on Apply to write this information to the COBOL85.CBR file.
Exit from the tool.
Start Debugging from Visual Basic
Start Visual Basic. (The instructions are based on Visual Basic 6.0, if you are using a different version, you may need to adapt them to your version.)
Open the Visual Basic project:
C:\Program Files\Fujitsu NetCOBOL for Windows\Samples\cobol\Sample13\sample13.vbp
Look at the form and code of this sample to get a feel for what it does.
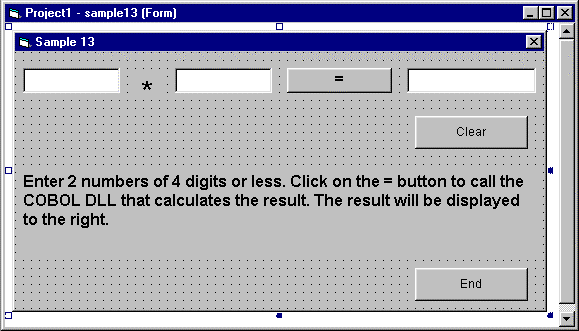
The form accepts two numbers and displays the result of multiplying those numbers when the "=" button (Command1) is pressed.
The Command1 code invokes the Sample13 DLL created using NetCOBOL:
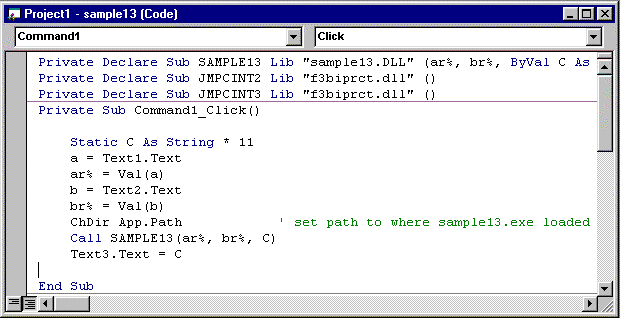
There are two other pieces of code you should note, although we will not discuss them further in this guide. They are the calls to JMPCINT2 and JMPCINT3. These calls initialize and close the COBOL run-time system.
Execute the Visual Basic code by repeating the Debug, Step Into function (available on the Visual Basic Debug menu, and the Debug toolbar).
When the Sample13 dialog displays, enter two numbers and click on the "=" button.
Continue stepping up to, and into, the statement:
Call SAMPLE13 (ar%, br%, C)
Debug the COBOL Code
Control passes to the COBOL code. The runtime system recognizes that the COBOL debugger should be invoked (because the @CBR_ATTACH_TOOL environment variable is set) so starts the debugger.
The debugger displays the Start Debugging window.
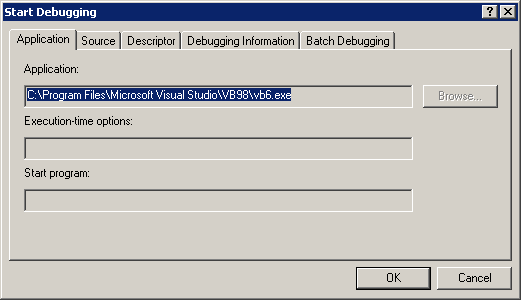
The debugger displays "VB6.EXE" as the application being executed. This is the application to which the debugger attaches. You need to be aware of this because you cannot close the debugger until you close Visual Basic.
You need to confirm two locations to the debugger: on the Source and Debugging Information tabs.
Select the Source tab and click on the Browse button by the "Source file storage folders" entry field.
The debugger displays the "Browse for Folder" dialog.
From the folder list select
C:\Program Files\Fujitsu NetCOBOL for Windows\Samples\cobol\sample13
Select the Debugging Information tab and click on the Browse button.
The debugger displays the "Browse for Folder" dialog.
Again select:
C:\Program Files\Fujitsu NetCOBOL for Windows\Samples\cobol\Sample13
You have now ensured that the debugger can find the COBOL source files and debugging information.
Click on OK to display the source in the COBOL debugger.
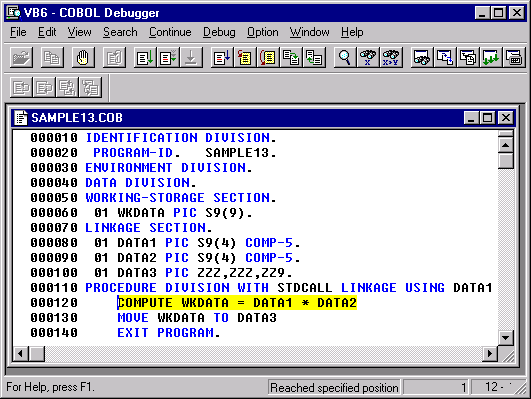
You can use all the COBOL debugging functions to debug this program. We will simply step through its three statements.
On the COBOL debugger toolbar, click the Step Into button, three times.
The debugger steps through the code. When the EXIT PROGRAM statement is executed, control returns to the Visual Basic debugger (the Visual Basic button on the task bar may flash to indicate you need to switch control to that window).
Continue stepping through the Visual Basic code, and select the Sample 13 window to see the result displayed.
Through this simple example you have seen how complex mixed Visual Basic and COBOL applications can be debugged effectively.