Conditions of Using Web Console
The system administrator or department management can use the Web Console.
The Web browsers that can be used as the Web console are as follows:
Microsoft(R) Internet Explorer(R) 6.0 (ServicePack1)
Windows(R) Internet Explorer(R) 7
Windows(R) Internet Explorer(R) 8
Windows(R) Internet Explorer(R) 9
Windows(R) Internet Explorer(R) 10
Windows(R) Internet Explorer(R) 11
Start Log Analyzer
Start the Main Menu through any of the following approaches.
Note
About the Web server connected with Log Analyzer (Web Console)
When Log Analyzer is started, one Web server can be connected. In the case of a 3-level structure, though the Log Viewer window can also be displayed by collecting to the Management Server, the window of the Log Analyzer cannot be displayed.
In the case of 2-level structure: Connect to the Management Server.
Select Start > Systemwalker Desktop Keeper > Server > Desktop Keeper Main Menu or Apps > Systemwalker Desktop Keeper > Desktop Keeper Main Menu on Management Server.
Specify the address of browser to "http://host name or IP address of Management Server/DTK/index.html".
When the port number of IIS is changed, specify as follows.
http://IP address: Port Number/DTK/index.html
In the case of 3-level structure: Connect to the Master Management Server.
Select Start > Systemwalker Desktop Keeper > Server > Desktop Keeper Main Menu or Apps > Systemwalker Desktop Keeper > Desktop Keeper Main Menu on Master Management Server.
Specify the address of browser to "http://host name or IP address of Master Management Server /DTK/index.html".
When the port number of IIS is changed, specify as follows.
http://IP address: Port Number /DTK/index.html
Refer to "1.2.45 IPv6 Support" for details on the IPv6 specification.
The Login window is displayed.
Enter the following information and click the Login button.
The system administrator and department management use the same login method.
When Systemwalker Desktop Patrol is linking with a single sign on, the input of the User ID is case-sensitive.
User ID: this is the User ID that is set in the Administrator Information Settings window of the Server Settings Tool.
Password: this is the Password that is set in the Administrator Information Settings window of the Server Settings Tool.
It is recommended to change the password regularly. For details on how to change the password, refer to "Change password".
The Status Window is displayed.
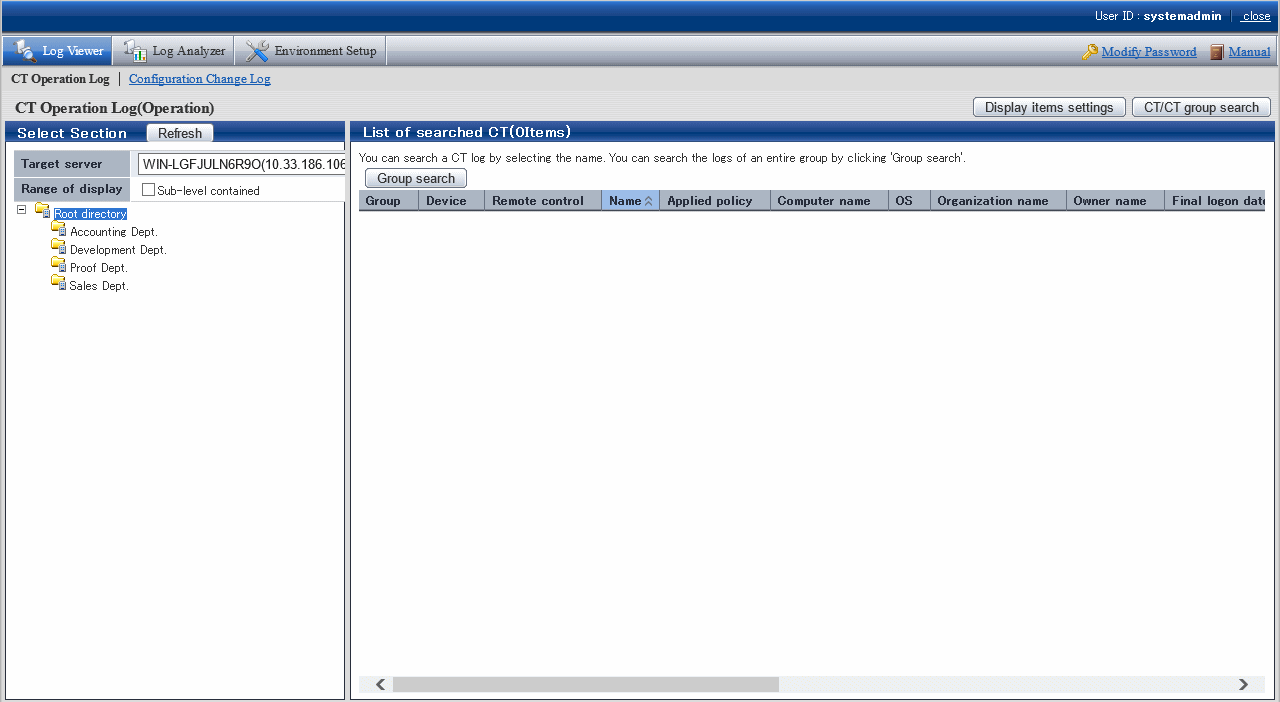
Click Log Management of Global Navigation.
Log Viewer is started and the CT Operation Log window is displayed.

Click Log Analyzer of Global Navigation.
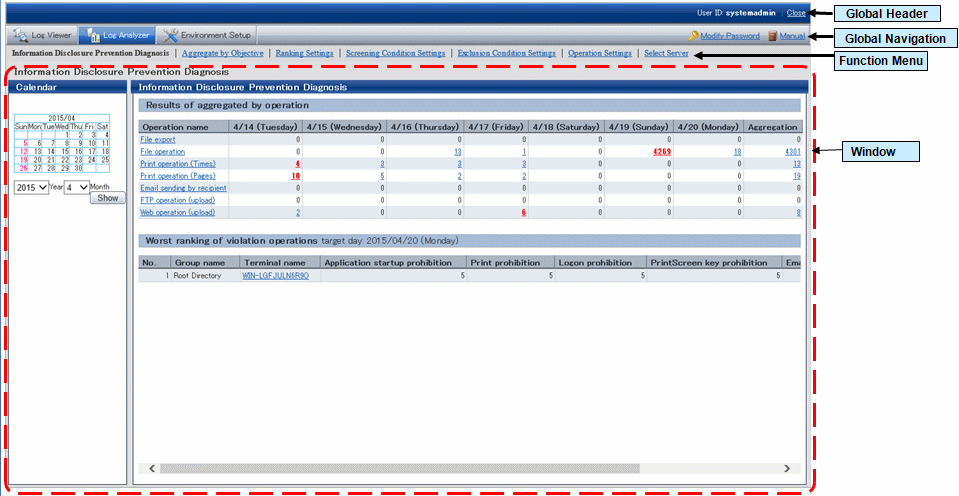
The Information Disclosure Prevention Diagnosis window is displayed.
In addition, in a system with multiple Log Analyzer servers, when Log Analyzer is selected for the first time after login, the window for server selection will be displayed. For details about the window for server selection, refer to "2.7.2.2.5 Select Log Analyzer Server".

Global Header
User ID: The login user ID is displayed.
Close: Close the Log Viewer window.
Global Navigation
Log Viewer: The window of Log Viewer is displayed.
Log Analyzer: The window of Log Analyzer is displayed.
Environment Setup: The options window (the window for setting the conditions of aggregation on which the result of aggregation displayed in the Status Window is based).
Modify Password: Change the password for starting the Web window. For details on how to change the password, refer to "Change password".
Manual: The manual is displayed.
Function Menu
Information Disclosure Prevention Diagnosis: Display the window of Information Disclosure Prevention Diagnosis.
Aggregate by Objectives: Display the window of Aggregate by Objectives. Perform aggregation by objectives after specifying date and time and keyword.
Ranking Settings: Set "Show/Hide" various ranking methods including by group, by terminal, by user and by terminal + user, as well as the number to of items to be displayed.
Screening Condition Settings: Set the keyword, domain, URL or application during log aggregation as the filtering conditions.
Exclusion Condition Settings: Set the terminal that is not to be aggregated during log aggregation.
Operation Settings: Perform settings for displaying the ranking of violations of information disclosure prevention diagnosis and start day of weekly report and Eco- auditing in report output.
Select Server: Display the server selection window. Click it when changing the Log Analyzer server currently selected.
When all of the following conditions are satisfied, this window will be displayed automatically:
When there are multiple Log Analyzer servers in the system structure
When Log Analyzer is used for the first time after login from the Main Menu
Note
Sometimes, it may take some time before the window is displayed
When a connection to the Log Analyzer server cannot be made due to the stop of the server and interruption of the network, depending on the environment and number of servers, it may take several minutes before the window is displayed.
Window
Calendar: Select the date to display the result of aggregation.
Result of aggregation by operation: Display the frequency of file export operation, file operation, printing operation (frequency and pages), E-mail sending operation, FTP operation (upload), Web operation (upload) as well as the total number of operations within recent 7 days.
Worst ranking of Violation operations: Display the number of logs on the date before logon or a selected date and the total value of operations relating to the following logs:
Application startup prohibition
Printing prohibition
Logon prohibition
PrintScreen key prohibition
E-mail attachment prohibition