This section explains the settings required for using the Log Analyzer.
Log transmission from the Management Server to the Log Analyzer Server should be performed during the time frame when there are less users on the clients (CTs), such as midnight. Regular transmission can be performed if the task function of the OS is used.
When transferring logs from the Management Server to the Log Analyzer Server, the following four items must be set:
Transmission target (Log Analyzer Server)
Transmission source (Management Server)
Log obtaining period
Data transfer
When the transmission target and transmission source are being installed, set for transferring administrator information. For settings items, refer to "Set Log Analyzer Server Environment on Management Server/Master Management Server" in Systemwalker Desktop Keeper Installation Guide.
The following describes how to set the log obtaining period.
Select Start > Systemwalker Desktop Keeper > Server > Log Analyzer Settings Apps > Systemwalker Desktop Keeper > Log Analyzer Settings and start the Log Analyzer Server Settings window.

Set the start date for log obtaining in Log obtaining period in the Data Transfer Settings tab.
Log transmission considers logs of the days before the task operation day (the day of executing data transmission command) as its target.
The log obtaining period, as the target date, is the date on which logs are registered to the Management Server, rather than the time when operation logs are generated in the client (CT).
The following describes the configuration value of the log obtaining period and the range of transferred logs:
When the log obtaining period is [In the latest 31 days (initial value)]
Log data from the day 1 to 31 days before the execution day of transmission task (day of executing data transmission command) will be transferred.
The following is the example of executing a task on May 31st.

When the log obtaining period is [Period designation]
Transfer log data from the day before the execution date of task to the specified date in the log obtaining period.
The following is the example of specifying April 1st, 2013 in the log obtaining period and executing the task on May 31st.

The log obtaining period is to specify the start time of transferring logs on the Management Server/Master Management Server to the Log Analyzer Server. Therefore, there is no need to reset the log obtaining period after the application is started.
Transfer logs and user information from the Management Server to the Log Analyzer Server.
Register data transfer tasks to the Log Analyzer Server to the Tasks feature of the operating system on which Management Server is running, and enable regular transfer of data. When transferring data to the Log Analyzer Server, there must be no user accessing the shared folder.
When other users access the shared folder, the network must be disconnected or logoff is required.
It takes about 25 minutes for transferring about 5 million logs. But processing time is only for reference. It might change based on PC performance and network status.
Note
For the data transfer start time, specify the time of day during which fewer users are on the client (CT).
While the log data is being saved and sent during data transfer, the following services of Management Server will be stopped. Therefore, perform data transmission when there are less users of the client (CT).
SWLevelControlService
SWServerService
In addition, after starting SWServerService or during date change (12am), confirmation of available database capacity will be performed. In the 15 minutes till the confirmation operation has completed, service may not be able to be stopped.
Therefore, do not transfer at the above time frame.
If any item other than the task start time has been changed in "7.12.3 Change the Data Transfer Task on the Management Server" and the start time settings are changed using this tool, the values set for all items other than the start time will revert to default values.
The following describes the settings procedures.
Click Start > Systemwalker Desktop Keeper > Server > Log Analyzer settings, or Apps > Systemwalker Desktop Keeper > Log Analyzer settings, to start the Log Analyzer Server Settings window.
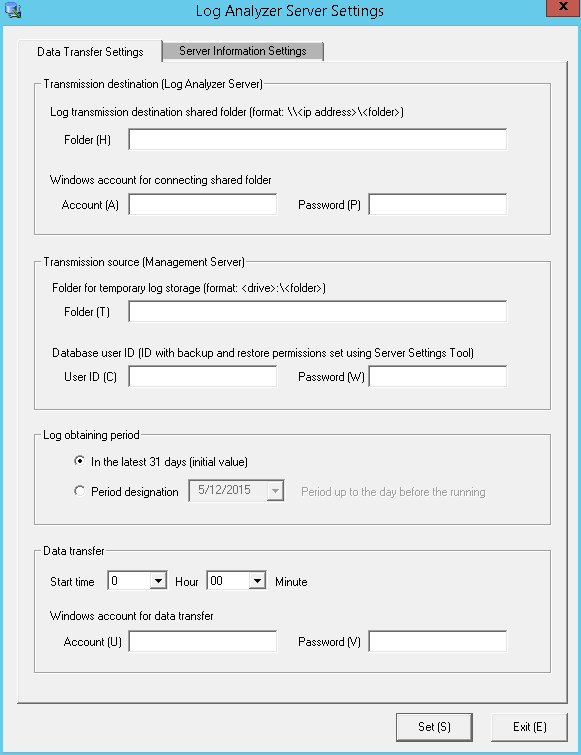
In Data transfer in Data Transfer Settings, specify the data transfer start time and the information for the Windows account that will implement the data transfer task.
In Windows account for data transfer, specify a user with administrator privileges.
Information
Data transfer can also be performed manually
Execute the following command in the command prompt to enter the "TRANS" folder in which the product has been installed.
cd [Installation Folder of Systemwalker Desktop Keeper]\LogAnalyzer\TRANS [Enter]
Execute the following batch command, save the log data transferred to the Log Analyzer Server as a CSV file and send it.
TRANS.bat [Enter]
After executing in the command prompt, the command prompt window will be closed automatically when the processing finishes. Execute the following command when it is expected to keep the command prompt window.
cmd /c TRANS.bat [Enter]
Save logs and user information from the Management Server to the database of the Log Analyzer Server.
In the Tasks feature of the operating system on which Log Analyzer Server is running, register the tasks for importing data to the Log Analyzer Server and deleting tasks, and enable regular data storage in the database.
Once data import in to the Log Analyzer Server is executed, the imported logs are aggregated at the same time as the import of the log data, and the aggregation result will be updated.
At this time, the difference between the aggregation results before and after the data import will be output as a log.
[Output Target of Logs]
[Installation Folder of Log Analyzer Server]\bin\batchnavi\update0.log
When the folder size is larger than 10MB, update0.log will change to update1.log, and update0.log will be generated (up to update4.log can be generated at most in sequence). The latest information is always recorded in update0.log.
[Output Content of Logs]
--------------------------------------------------------------------------------------
The updated information of counting implementation date 2013/04/21 01:00:00 is output
Start
20130421 operation happening day 20130408 information disclosure (0, 0, 0, 0, 0) terminal use (0, 0, 20) violation operation (0, 0, 0, 0, 0) printing volume auditing (0)
20130421 operation happening day 20130409 information disclosure (0, 0, 0, 0, 0) terminal use (0, 0, 31) violation operation (1, 0, 1, 0, 0) printing volume auditing (2)
End
--------------------------------------------------------------------------------------
The above is the aggregation result of data moved in on April 21st, 2013, indicating the number of the updated operation logs on April 8 and 9, and the different number being updated is displayed in ().
The number in () is the different number of each of the following logs (*).
Information disclosure (file export, file operation, times of printing operation, number of pages of printing operation and E-mail sending by recipient address)
Terminal usage (window title obtaining with URL, E-mail sending by recipient address and application startup)
Violation operation (application startup prohibition, printing prohibition, logon prohibition, PrintScreen key prohibition and E-mail attachment prohibition)
Printing volume auditing (times of printing operation)
*) logs displayed in the report output by the Report Output Tool (Only information disclosure is also displayed in the information disclosure prevention diagnosis window of the Web Console.)
It will take about 80 minutes to move about 10 million logs (but the processing time is only for reference. It might change because of CPU, memory, disk performance, operation status of other applications, etc., of the PC).
Note
To ensure disk capacity, save the CSV files of log data that are not needed to external media regularly
As for the CSV files of log data transferred from the Management Server to the Log Analyzer Server, even if they are saved to the database on the Log Analyzer Server, they will still remain on the disk of the Log Analyzer Server.
When the capacity of the Shared Folder is exhausted, logs cannot be transferred from the Management Server/Master Management Server. Therefore, confirm the capacity of the shared folder and delete the analyzed and aggregated logs after saving them.
The structure of shared folder of the Log Analyzer Server is shown as follows.
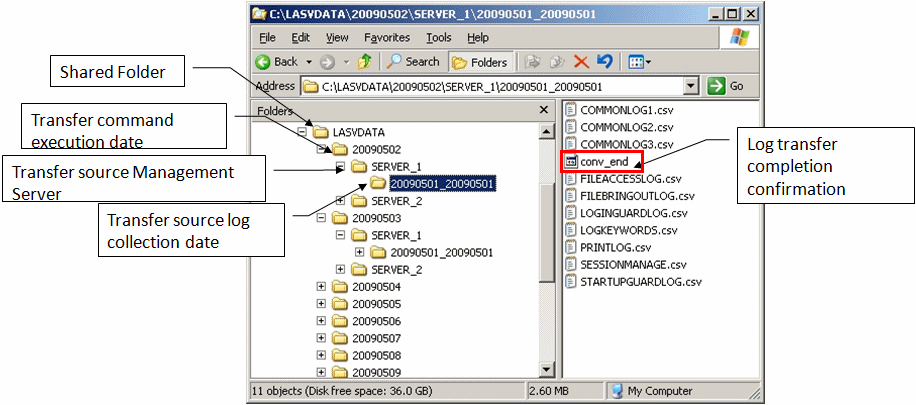
Logs that have not finished analyzing and aggregating on the Log Analyzer Server cannot be saved or deleted.
Under the folder of the transmission source log collection day, the created folder of "File for confirming the completion of log transmission (conv_end)" has finished log analyzing and aggregating, and has been saved to the database on the Log Analyzer Server.
When "File for confirming the completion of log transmission (conv_end)" has been created in all "Folder of transmission source log collection day" in the "Transmission source Management Server name" folder under the "Transmission command execution day" folder in the above image, saving and deletion can be performed. Save and delete logs according to the "Transmission command execution day" folder unit.
If any item other than the task start time has been changed in "7.12.4 Change the Data Import Task on the Log Analyzer Server" and the start time settings are changed using this tool, the values set for all items other than the start time will revert to default values.
The following describes the settings procedure.
Log on to the Log Analyzer Server as the Log Analyzer user (the Windows account set during the Log Analyzer Server installation.
Select Start > Systemwalker Desktop Keeper > Log Analyzer > Data Import Settings, or Apps > Systemwalker Desktop Keeper > Data Import Settings to start the Data Import Settings window.
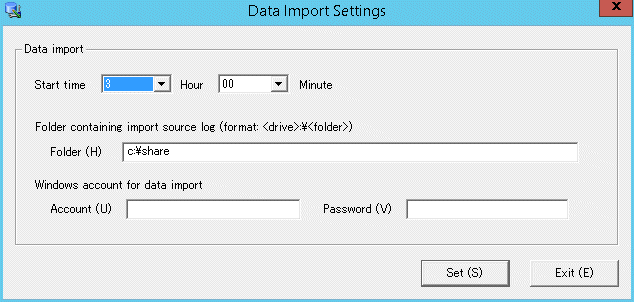
In the Data Import Settings window, set the start time for data import.
Item name | Description | |
|---|---|---|
Data import | Start time | This item is used to configure the settings to import data regularly. Specify the start time for data import. Set the start time of data import later than the data transfer start time so that the data import will start after execution of data transfer is finished. |
Account / Password | Specify the Windows account and its password used when constructing the database. | |
Information
Data can also be imported manually.
Execute the following command in the command prompt of the Log Analyzer Server to access to the folder for saving tools in the installation folder of the Log Analyzer Server.
cd [Installation Folder of Log Analyzer Server]\bin\dttool [Enter]
Execute the following command to add data to the database of the Log Analyzer Server.
DttoolEx.exe -f [Path of shared folder of log transmitting target] [Enter]
Start Log Analyzer Server and set the conditions for aggregation and report output.
As conditions can be set according to the operating environment of PC and business status, the aggregation result can be acquired by functions.
Start Log Analyzer Server
Start the main menu with any of the following methods.
Note
About Web Server connecting to Log Analyzer (Web Console)
When starting Log Analyzer, only one Web Server can be connected. In a 3-level structure, though the Log Viewer window can also be displayed even if the Management Server is connected, the Log Analyzer window cannot be displayed.
In a 2-level system structure: Connect to the Management Server.
Select Start > Systemwalker Desktop Keeper > Server > Desktop Keeper Main menu or Apps > Systemwalker Desktop Keeper > Desktop Keeper Main Menu on the Management Server.
Specify "http://host name or IP address of Management Server/DTK/index.html" in the address bar of the Brower.
When the port number of IIS is changed, specify as follows:
http://IP address: port number/DTK/index.html
Refer to "1.2.45 IPv6 Support" for details on the IPv6 specification.
In a 3-level system structure: Connect to the Master Management Server.
Select Start > Systemwalker Desktop Keeper > Server > Desktop Keeper Main menu or Apps > Systemwalker Desktop Keeper > Desktop Keeper Main Menu on the Master Management Server.
Specify "http://host name or IP address of Master Management Server/DTK/index.html" in the address bar of the Brower.
When the port number of IIS is changed, specify as follows:
http://IP address: port number/DTK/index.html
Refer to "1.2.45 IPv6 Support" for details on the IPv6 specification.
The Login window is displayed.
Enter the following information and click the Login button.
The following information is User ID and Password set using the Server Settings Tool.
When using Log Analyzer, the system administrator with "Log Viewer" authority must be specified.
User ID
Password
It is recommended that the password be changed regularly. For details on how to do so, refer to "Change password".
Click Log Management of Global Navigation in the displayed status window.
Start Log Viewer and the CT Operation Log window is displayed.
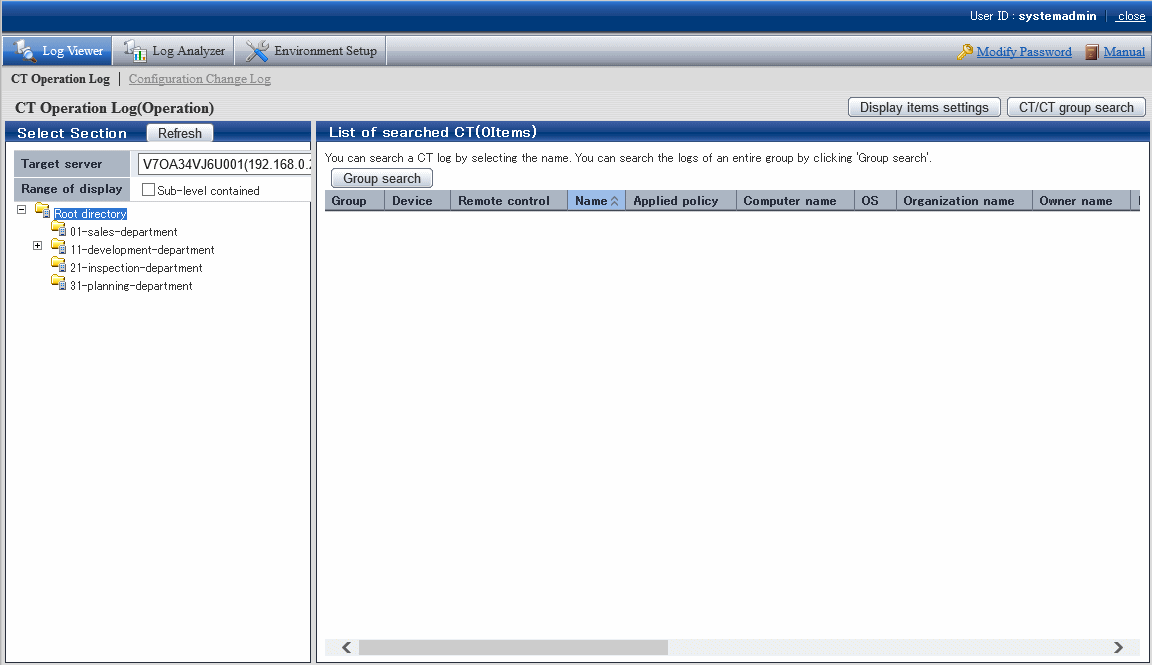
Click Log Analyzer of Global Navigation.
The Information Disclosure Prevention Diagnosis window is displayed.
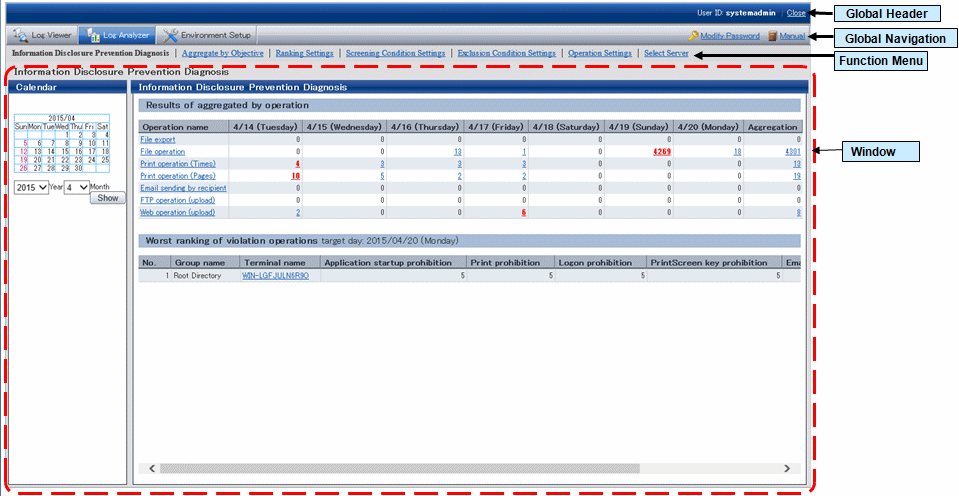
Global Header
User ID: The login user ID is displayed.
Close: To log off.
Global Navigation
Log Viewer: The Log Viewer window is displayed.
Log Analyzer: The Log Analyzer window is displayed.
Modify password: Used to Modify password when starting the Web window. For details on how to do so, refer to "Change password"
Manual: The manual is displayed.
Function menu
Information Disclosure Prevention Diagnosis: The Information Disclosure Prevention Diagnosis window is displayed.
Aggregate by Objective: Display the aggregate by objective window.
Ranking Settings: Set "Display/Hide" and the displayed number of various rankings by group, user and terminal+user.
Screening Condition Settings: Set keywords, domains, URLs or applications during log aggregation as screening conditions.
Exclusion Condition Settings: Set terminal as non-aggregation target during log aggregation.
Operation Settings: Set ranking display of information disclosure prevention diagnosis and set the day of a week to start weekly report and eco auditing in the report output.
Select Server: Display the select server window. Click to change the currently selected Log Analyzer Server.
This window will be automatically displayed when the following conditions are satisfied.
When there are multiple Log Analyzer Servers in the system structure
When login through the main menu and Log Analyzer is used for the first time
Note
Make sure to use [Logout] to close the settings window
When the screening condition settings window, the exclusion condition settings window and operation settings window are used. If closing them through [x] of the Brower, the warning message will appear even if there is no other user of these windows. At this time, the new user cannot use the settings window without receiving a warning message until 24 hours later (Selecting "No" will shift it to the information disclosure prevention diagnosis window).
Make sure to use Logout when closing the settings windows.
Set the displayed number of the ranking number. The settings of the ranking display number will be displayed immediately after being modified.
Note
Do not modify the conditions when moving logs or using Log Analyzer function or Report Output Tool
This may cause conflicts and errors in the aggregation result and diagnosis result or in the report output result.
Select Ranking Settings of the function menu.
The following window is displayed.
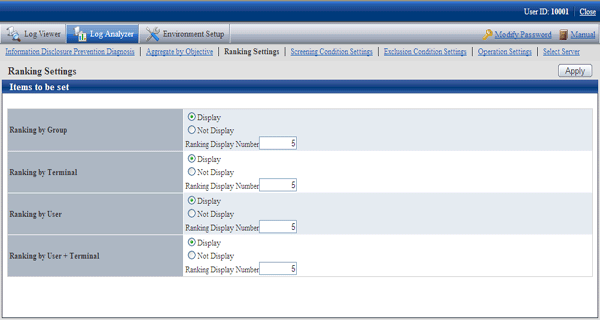
Set each ranking as follows:
Settings of Display/Not Display
Display (initial value): The ranking is displayed.
Not Display: The ranking is not displayed.
Settings of Ranking Display Number
Set the displayed ranking number to within 1-99. The initial value is "5".
If the same sequence exists, a maximum of 99 lines can be displayed for ranking.
Click the Apply button.
The Information Disclosure Prevention Diagnosis window with an updated configuration value is displayed again and a message indicating the completion of settings appears.
In order to easily detect dangerous operations such as access to important files, E-mail sending to unauthorized domains and ever increasing logs, screening conditions during aggregation can be set.
Due to reasons such as adding, modifying or deleting settings, the time for screening conditions to be updated to aggregation information may be inconsistent.
When performing log transmission as follows:
Transferring logs on March 1
Transferring logs on March 2
Transferring logs on March 3,
if screening condition settings have been set after log transmission on March 2, the screening conditions will be applied and aggregation will be performed after the aggregation during log transmission on March 3. (For logs before March 2, the screening conditions cannot be applied as the conditions have not been set at that time)
In order to apply the screening condition settings and aggregate before March 2, aggregation should not be performed again after the re-aggregation option of "DTTOOLEX.EXE (data transmission or deletion for the Log Analyzer Server)" has been executed.
Note
Do not modify the conditions when moving logs or using when Log Analyzer function or Report Output Tool
This may cause conflicts and errors in the aggregation result and diagnosis result or in the report output result.
Select Screening Condition Settings of the function menu.
The following window is displayed.
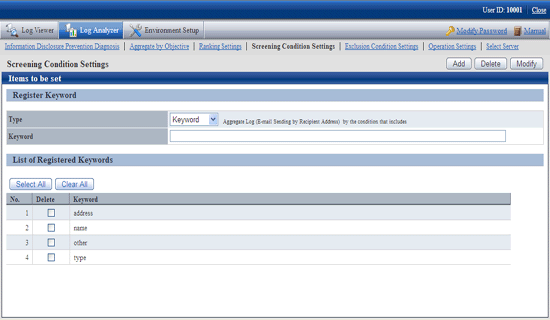
Item Name | Description | |
|---|---|---|
Register Keyword | ||
Type | Set the type of screening condition. | |
Keyword | Specify the keywords for judging aggregation target log. According to the conditions selected in Type, labels displayed on the left of the input field may be different. Note After the setting, it is likely that multi-byte characters cannot be input in the keyword field. At this time, click the input field to enable the input of multi-byte characters. | |
List of Registered Keywords | The list of registered keywords is displayed. | |
Select All | Select all keywords in List of Registered Keywords. | |
Clear All | Cancel the selection of all keywords in List of Registered Keywords. | |
Add | Register the specified keyword in keyword input field. | |
Delete | Delete the keyword selected in List of Registered Keywords. | |
Modify | Modify the registered keywords. | |
Select the type of the screening conditions in Type and specify the keyword in the keyword input field.
The characters that can be entered are as follows:
Up to 40 fullwidth characters or Up to 80 halfwidth characters can be registered. However, the character string including ",", "'",and halfwidth or fullwidth "_","%" cannot be registered.
When entering the characters, external characters and platform dependent characters may be replaced by other characters and cannot be displayed correctly.
The items that can be selected, keywords can be specified and aggregation target logs are shown as follows.
Items that can be Selected | Type of Analysis for Validity of Exclusion Conditions | Aggregation Target log | Keywords can be Specified (Notes) | Aggregation conditions |
|---|---|---|---|---|
Keyword | Information disclosure analysis | File export File operation Printing operation E-mail sending by recipient address FTP operation Web operation | Strings containing file or file path | Aggregate the content that matches with the specified keyword in Keywords (partially matching). |
Domain | Information disclosure analysis | E-mail sending by recipient address | Strings contained in E-mail address | Aggregate the content that does not match (backward matching) with the specified keyword in Keywords. |
Terminal usage analysis | E-mail sending by recipient address | |||
URL | Terminal usage analysis | Window title obtaining with URL | Strings contained in the domain part in URL | Aggregate the content that does not match (partially matching) with the specified keyword in Keywords. |
Application | Terminal usage analysis | Application startup | Name of result file excluding extension | Aggregate the content that does not match (complete matching) with the specified keyword in Keywords. |
Notes: The specified string is case-sensitive.
The result file name of the application may be modified by the OS to uppercase and lowercase letters. Confirm how to record the logs.
For the keyword specified by the application, do not use capital single-byte letters and register it after modifying all of them to lowercase ones.
Up to 200 keywords not exceeding 4,000 halfwidth characters in total can be registered. Count any character that is not part of the Shift-JIS encoding as eight halfwidth characters.
Click the Add button.
Keywords are displayed in List of Registered Keywords.
Execute the DTTOOLEX.EXE command and perform aggregation again.
If aggregation is not performed again, the number in aggregation results might be inconsistent with the number in the log list in the Web Console and report output.
In addition, as the logs saved on the Log Analyzer Server are taken as the target for re-aggregation, re-aggregation cannot be performed if there is no log on the current Log Analyzer Server.
For the re-aggregation process, refer to the "-r option" of "DTTOOLEX.EXE (for moving and deleting data of Log Analyzer Server" in Systemwalker Desktop Keeper Reference Manual.
Select the keyword to be deleted in List of Registered Keywords.
To delete all the registered keywords, click the Select All button.
Click the Delete button.
The display of List of Registered Keywords is updated.
Select the strings of keyword to be modified in List of Registered Keywords.
Enter the modified keywords in the input field.
Click the Modify button.
The display of List of Registered Keywords is updated.
For terminals that must access important files for business and terminals that perform large amount of file access daily, each operation can be set as a non-aggregation target according to the judgment of the system administrator.
Set group information and CT information managed in the Management Server required for exclusion condition Settings . When moving administrator information or logs from the Management Server to the Log Analyzer Server, the information will be imported to the Log Analyzer Server.
The date on which the logs on this client (CT) are moved is not consistent with the date on which the exclusion conditions set for this client (CT) are updated.
When moving logs as follows:
Move terminal information and logs of terminal A, B and C on March 1
Move terminal information and logs of terminal A, B, C and D on March 2
Move terminal information and logs of terminal A, B, C and D on March 3,
the exclusion conditions can be set for terminal D after completing log moving on March 2.
In addition, the update of exclusion settings for terminal D will be started from the aggregation process when moving logs on March 3 (even if logs of terminal D exist in the logs moved on March 2nd, these logs will not be aggregated due to the settings of exclusion conditions at this time).
In order to apply the screening conditions and perform the counting before March 2nd, re-counting should not be performed after executing the re-counting option of "DTTOOLEX.EXE (for moving and deleting data of Log Analyzer Server)".
Note
Do not modify conditions when moving logs or using Log Analyzer Server and Report Output Tool.
This may cause conflicts and errors in the aggregation result and diagnosis result or in the report output result.
About the smart device (agent) operation log
The smart device (agent) is displayed in the list but the smart device (agent) operation log is not aggregated in the Log Analyzer.
Select Exclusion Condition Settings of the function menu.
The following window is displayed.
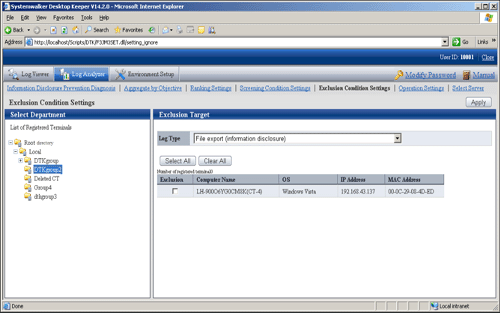
Item Name | Description | |
|---|---|---|
Select Department | Level relations of each department can be displayed in the tree structure. Select the department to which the terminal that requires the settings of exclusion conditions belongs. Note About Not Configured group If Manage under the group that is not configured has been set in System settings > Set group that is not configured of Server Settings Tool, the groups displayed in Select Department will manage the client (CT) in "Root directory" group instead of "Not Configured" group.
| |
List of Registered Terminal | After clicking, all terminals registered as excluded target will be displayed in the list for this operation log. It is used in the cases such as when all registered terminals are deleted. | |
Exclusion Target | The list of terminal as excluded target is displayed.
| |
Log Type | Select the operation log as settings target of exclusion condition Settings . | |
Select All | Select all terminals in the terminal list. | |
Clear All | Cancel the selection of all terminals in the terminal list. | |
Apply | Update the exclusion condition settings according to specified content. | |
In the Select Department tree, select the department to which the terminals with set exclusion conditions belongs.
Select terminals to be excluded from the aggregation target in Exclusion Target.
Up to 400 logs can be registered.
Select operation logs as settings target of exclusion condition Settings in Log Type of Exclusion Target.
The name of the operation that can be selected and logs excluded from the aggregation target are shown as follows.
Name of Operation that can be Selected | Type of Analysis with Valid Exclusion Conditions | Operation Log of Counting Excluded Targets |
|---|---|---|
File export | Information disclosure analysis | File Export Log |
File operation | Information disclosure analysis | File Operation Log |
Printing operation | Information disclosure analysis | Printing Operation Log |
E-mail sending by recipient address | Information disclosure analysis | Log of E-Mail sending by recipient address |
Window title with URL | Terminal usage analysis | Window Title Obtaining Log with URL |
Application startup | Terminal usage analysis | Application Startup Log |
FTP operation | Information disclosure analysis | FTP operation log (upload) |
Web operation | Information disclosure analysis | Web operation log (upload) |
Click the Apply button.
The message indicating the completion of settings appeared.
Execute the DTTOOLEX.EXE command and perform the aggregation again.
If re-aggregation is not performed, the number in the aggregation result may be inconsistent with the number in the log list in the Web Console and report output.
In addition, as the logs saved on the Log Analyzer Server are taken as the target for re-aggregation, re-aggregation cannot be performed if there are no logs on the current Log Analyzer Server.
For the re-aggregation process, refer to the "-r option" of "DTTOOLEX.EXE (for moving and deleting data of Log Analyzer Server" in Systemwalker Desktop Keeper Reference Manual.
Set the ranking display of information disclosure prevention diagnosis, set the day of a week to start weekly report in the report output, set the target value used for judging improvement/deterioration of the situation and set eco auditing, etc.
The settings of other conditions will be updated immediately after they are modified.
Note
Do not modify conditions when moving logs or using Log Analyzer Server and Report Output Tool.
This may cause conflicts and errors in the aggregation result and diagnosis result or in the report output result.
Select Operation Settings of the function menu.
The following window is displayed.
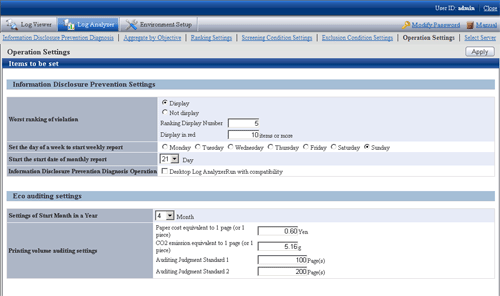
Enter the configuration value in each item.
Information Disclosure Prevention Settings
Item Name | Description |
|---|---|
Worst ranking of violation |
|
Set the day of a week to start weekly report | Specify the day of the week as the start date of monthly report. |
Start the start date of monthly report | Specify the date as the start date of the monthly report. |
Information Disclosure Prevention Diagnosis Operation | When Operation in Compatible with Desktop Log Analyzer is selected, the Aggregate by objective window will be displayed after clicking terminal name in the ranking of information disclosure prevention and diagnosis, and it will run in the same way as Systemwalker Desktop Log Analyzer. [When this item is not selected] After clicking the number of Aggregation Result by Operations in the Information Disclosure Prevention and Diagnosis window, ranking by operations will be displayed. [If this item is selected] After clicking the number of Aggregation Result by Operations in the Information Disclosure Prevention and Diagnosis window, ranking by operations will be displayed. As the item of each ranking, after clicking the link displayed in group name, terminal name, terminal+user name, the Aggregate by objective window will be displayed. Set the conditions such as the screening period manually in the Aggregate by objective window and re-perform the counting. Through the ranked user name and PC name, the detailed operation (logs) cannot be carried out. |
IP address display settings |
|
Eco auditing settings
Item Name | Description | |
|---|---|---|
Settings of Start Month in a Year | When counting the annual accumulation, specify the start month of the year as a reference in the printing volume auditing report and all-in-one PC/printer paper usage report*. | |
Printing volume auditing settings | Paper cost equivalent to 1 page (or 1 piece) | In the printing volume auditing report, specify the coefficient for calculating paper cost in RMB. In the printing volume auditing report, use this coefficient as the Paper cost equivalent to 1 page. |
CO2 emission equivalent to 1 page (or 1 piece) | In the printing volume auditing report, specify the coefficient for calculating CO2 emission in terms of g. In the printing volume auditing report, use this coefficient as the CO2 emission equivalent to 1 page of printing paper. | |
Auditing Judgment Standard 1 | When the terminal that exceeds the printing upper limit is output from the printing volume auditing report, specify the judgment standard value for the exceeded amount (pages) in terms of pages. The configuration value here will be updated to "Ratio of Terminal by Exceeded Amount" of "Status of Exceeding Upper Limit of Printing" sheet and "[ | |
Click the Apply button.
Select/change the Log Analyzer Server in use in the system where multiple Log Analyzer Servers exist.
Note
Do not select Log Analyzer Server when using Log Analyzer function and moving logs
This may cause conflicts and errors in the aggregation result.
Do not modify server structure and settings during login
This may cause situations such as being unable to identify correctly and unable to set and process correctly. If this is the case, login again.
It will take some time to display the window.
When Log Analyzer Server cannot be connected due to reasons such as server stoppage or network interruption, it may take several minutes to display the window, based on the environment and number of servers.
When the status of Log Analyzer Server changes, it will take some time until the change is reflected.
When the status changes, for example if the disconnected the Log Analyzer Server becomes connectable, the status will not be updated immediately. Confirm it again later.
Select Select Server of the function menu.
The following window is displayed.
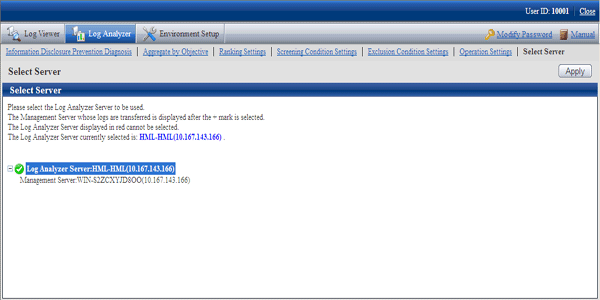
The window will be automatically displayed if all of the following conditions are satisfied:
When there are multiple Log Analyzer Servers in the system structure
When login from the main menu and Log Analyzer is used for the first time
Select Log Analyzer Server
Select the Log Analyzer Server displayed in blue (server name and IP address are displayed) from the tree structure.
The selected Log Analyzer Server will be displayed in reverse color.
Click the + button and the Management Server from which the log data are moved to Log Analyzer Server is displayed.
Log Analyzer Server displayed in red is not available, so it cannot be selected. For this server, refer to "Messages Output in Web Console" in Systemwalker Desktop Keeper Reference Manual to process [ERR-DTLAC001].
Click the Apply button.