This section describes how to operate the Analysis/Planning window.
Note
The following kinds of problems may occur if you try to display content (graphs or tables):
The operation terminates with error code 1572864.
"Chart is unavailable" is displayed instead of the graphics for the graph.
The graph image may be left out (only graphs are not displayed).
The following error message may be displayed:
"The specified CGI application misbehaved by not returning a complete set of HTTP headers. The headers it did return are: Unable to register TclNotifier window class" "ohd_update error." "Ohd file create error." |
These problems may be due to insufficient space in the desktop heap for the operation management client. Refer to "6.1 Content Display Errors" to increase the size of the desktop heap.
Starting
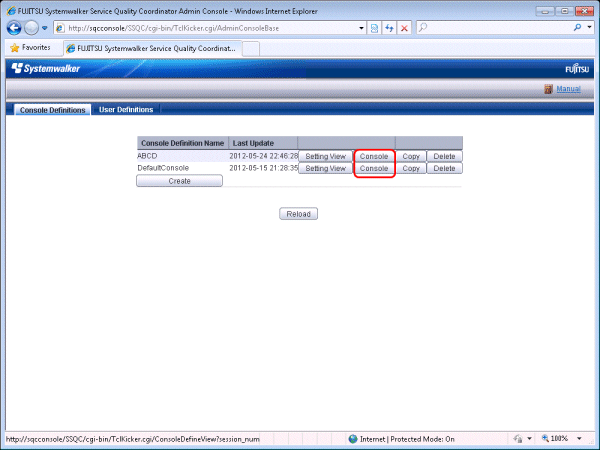
Start the console by clicking the Console button on the Console Definitions tab of the Admin Console window.

Or start the console directly by specifying the URL.
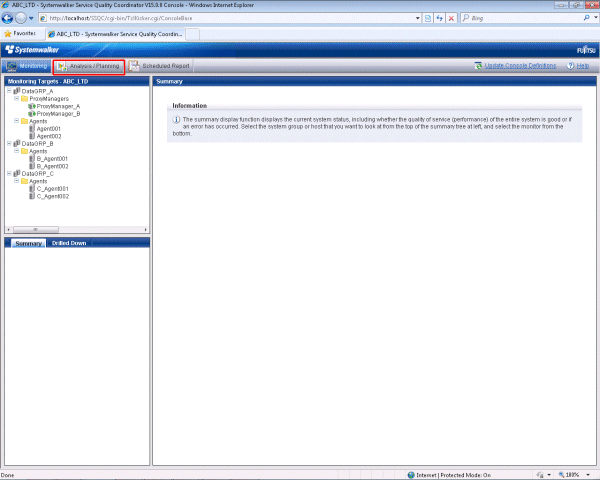
Click on Analysis/Planning on the global navigation bar in the console to start.

Note
Do not perform operations in the Analysis/Planning window using the pop-up context menu that appears when the right mouse button is clicked.
Window configuration
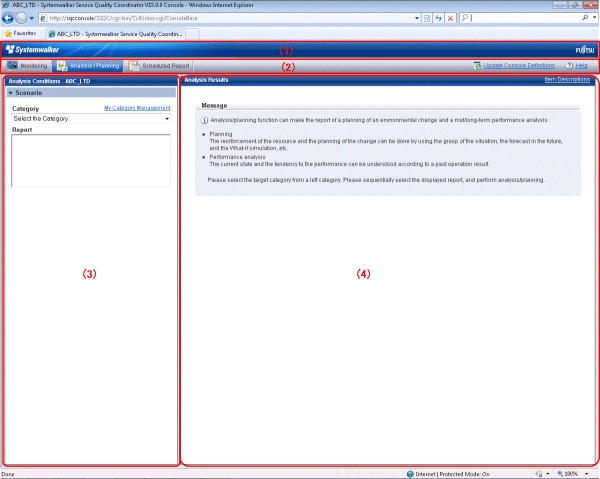
When started, the following Analysis/Planning window is displayed.

The Analysis/Planning window is made up of the following:
No. | Component | Description |
|---|---|---|
(1) | Global header | The Systemwalker and Fujitsu logos are displayed. |
(2) | Global navigation bar | The menus are as follows:
|
(3) | Analysis Conditions area | Set and register categories, reports, and the analysis conditions for the various reports. Operations in the Analysis Conditions area are described in the sections that follow. |
(4) | Contents display area | The contents of the reports are displayed. |
Basic operations
The following operations are possible in the Analysis/Planning window.
Operation | Description |
|---|---|
Use scenarios to create reports | Analysis and planning that meets your aims is possible by checking each report displayed in the categories in turn. You can use the templates provided with the product and the "My Category" you register for each console. The analysis conditions can be saved when using a My Category. |
Refer to the history of created reports | Displays a history of created reports. Up to 50 reports are saved in the history. If this number is exceeded, reports will be automatically deleted in chronological order. |
Edit My Category | The following operations are possible with the My Category items you register for each console:
|
See
Refer to "Basic specifications in the Analysis Conditions area" for details on how to manipulate analysis conditions.
Components in the Analysis Conditions area

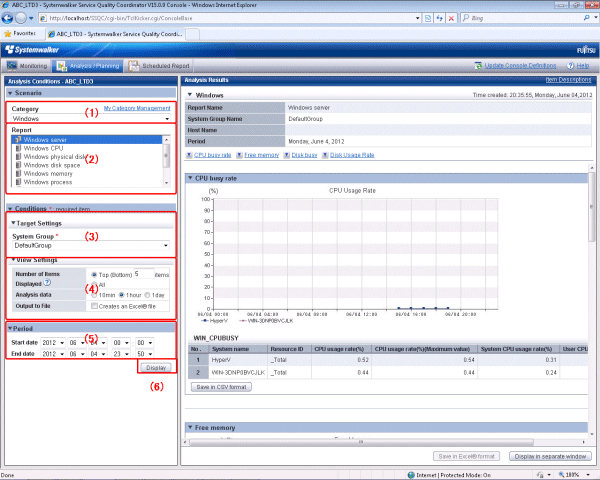
Basic specifications in the Analysis Conditions area
No. | Component | Description |
|---|---|---|
(1) | Category | Select a category that matches the purpose of the operation. |
(2) | Report | Select a report that matches the purpose of the operation. |
(3) | Target Settings | Specify items relating to the report target. |
(4) | View Settings | Specify report data intervals, number of display items, and file output. The way to specify the number of display items depends on the type of report. The number of items that can be displayed legibly in the graph is about 10. The graph may be disrupted by the legend if there are more than 10. The graph size can be set in Advanced Settings for some report types. |
(5) | Period | Specify the analysis period. |
(6) | Display button | Click to display the analysis results in the report content area. |