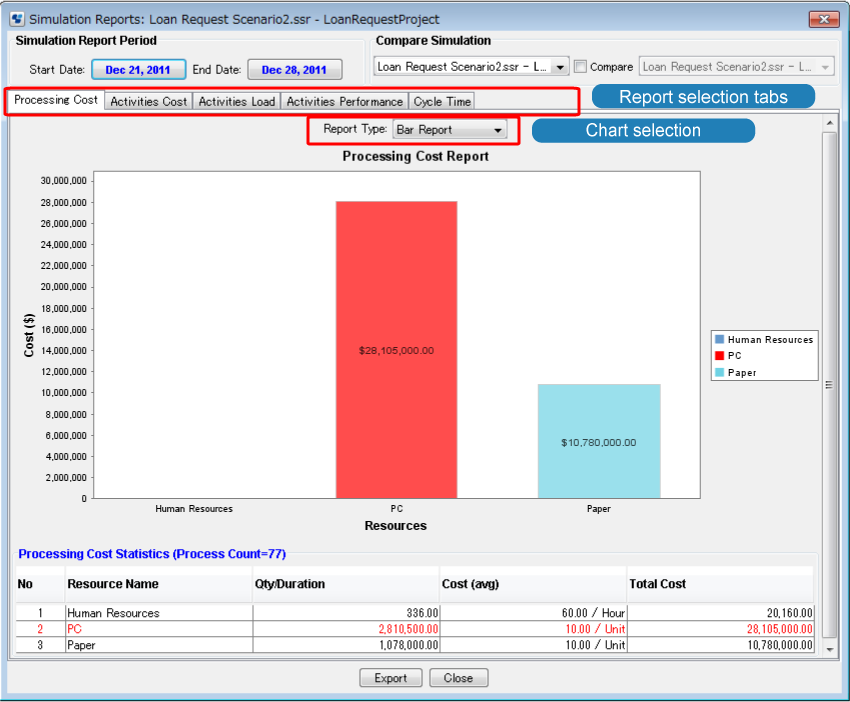
Whenever you have executed a simulation run, you can generate simulation reports. A simulation report is displayed in a separate window that consists of various parts. The parts depend on the type of report displayed. For example:
Figure 12.14 Simulation Report Parts
The various types of report can be displayed by clicking the respective tab:
Figure 12.15 Report Types
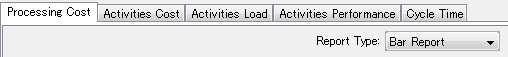
You can change the layout of a report by selecting the relevant entry from the Report Type drop-down list. For example, a Processing Cost report can be displayed as bar report or pie report.
A detailed report for the individual activities, resources, etc. can be opened by double-clicking an entry in the Statistics area of the Simulation Reports window.
The following types of report are available:
Processing Cost Report
The Processing Cost report shows the total amount of cost (based on the defined resources) of the simulated process activities within the specified period. The cost of human resources is shown in one group named as "Human Resources". The cost of all other resources are shown by a separate bar or pie segment for each resource.
The highest or critical cost flashes and is shown in the color red. The row in the Processing Cost Statistics containing the critical values (highest values among the values in the table) is also shown in red. In addition, the Processing Cost Statistics show the number of process instances completed between the report start date and the report end date.
Double-clicking any particular resource opens the detail report for this resource, and processing cost drilled down to the selected resource only will be shown. Information on the other resources is available by clicking the respective tab.
Activities Cost
The Activities Cost report shows the cost for every performed activity, i.e. for every node that has been processed, calculated on the basis of every resource assigned to an activity. The costs are divided into the total amount of human resource costs and other resource costs.
Double-clicking any particular activity opens the detail report for this activity. Information on other activities is available by clicking the respective tab.
Activities Load
The Activities Load report shows, for each activity, how often a it has been triggered and processed. For each activity, you see how often it has been completed and how many instances are still in a waiting or working state.
Double-clicking any particular activity opens the detail report for this activity. Information on other activities is available by clicking the respective tab.
Activities Performance
The Activities Performance report shows, for every activity, the total processing time. The processing time is combined of waiting hours (hours passed during which the activity could not be processed because another instance was still in progress) and processing hours (hours it took in order to complete the activity instances).
Double-clicking any particular activity opens the detail report for this activity. Information on other activities is available by clicking the respective tab.
Cycle Time
The Cycle Time report shows the number of process instances completed between the report start and end date in three categories: minimum days, maximum days, and average days.
Note
If you are simulating a process definition which contains Subprocess Node or Chained-Process Node, the Cycle Time report of the simulation displays the process instance cycle information of only the primary (parent) process definition.
Comparative Reports
Simulation reports can be generated on two sets of simulation data for comparison purposes. Such a comparison results in the generation of comparative reports. You can consider only one process definition at a time and both of the simulations must have a result corresponding to the same process definition, but the simulations may have different scenarios. The above-mentioned reports are available as comparative reports and behave in the same way as reports for single simulations.