This section explains the operations that can be performed on displayed Drilled-Down display content.
Table sorting
When the header section of any column in a table displayed in the Drilled-Down display content is selected, the table can be sorted using the selected column as the sort key.
Sorting can be toggled between ascending and descending order.
Note
Numerical sorts only operate correctly when all the values in the specified column are numerical values. Sorting cannot be performed correctly if the column contains non-numerical data such as Null values.
Date and time sorts cannot be performed correctly if the number of digits (yyyy/mm/dd hh:mm:ss, etc.) is not uniform throughout the column. Care must be taken when data has been imported from user data.
Save in CSV Format
The following buttons are located underneath the Drilled-Down display content:
Save in CSV format
This link enables the displayed range of data to be downloaded in CSV format.
Point
If Server Instance under Interstage (TxnAnalysis) Java EE, Work Units under Interstage (TxnAnalysis), and data in TxnID units are downloaded and displayed in Excel, they will not be displayed correctly because the default display format of the collection time cell (sdattim) is "mm:ss.0". The display can be corrected by setting the display format of the cell to "yyyy/mm/dd hh:mm:ss.000" in the user definition.
Analysis/Planning
This link calls a Detailed Analysis/Planning window for displaying a graph of the data currently displayed.
For end use response information, specific content can be displayed by setting the URLs of fully downloaded Web pages (i.e., no errors occur when the Web page is displayed, or the display is not canceled) as specific resources in Resources (URL) under WebSites or in nodes under WebSites (URL, DNS, TCP).
If an URL whose page is not fully downloaded is specified as a resource, the corresponding data will not be available and content will not be displayed.
Refer to "1.2.2.7 Resources (URL)" for details on setting specific resources in the Drilled-Down display.
Point
By selecting a specific resource node under WebSites and clicking Completion number of cases among the items in the content table that is displayed, a new window will be opened and details about those completed items will be displayed as a data list.
And, by clicking Elapsed Time in the table items, an internal sequence information showing the Web page data being downloaded will be displayed.
For transaction breakdown analysis information collected from Interstage Application Server, selecting a Server Instance or a Work Unit node under the Interstage(TxnAnalysis) tree displays the breakdown analysis information for all translations for the Web applications (servlets and JSPs) and EJB applications executed in that Server Instance or Work Unit.
It is also possible to display breakdown analysis information focusing on a single transaction by specifying a specific transaction ID in TxnIDs under the Server Instance or the Work Unit node.
Refer to "1.2.2.9 TxnIDs" for details on how to set specific transaction IDs.
Viewing transaction breakdown analysis content
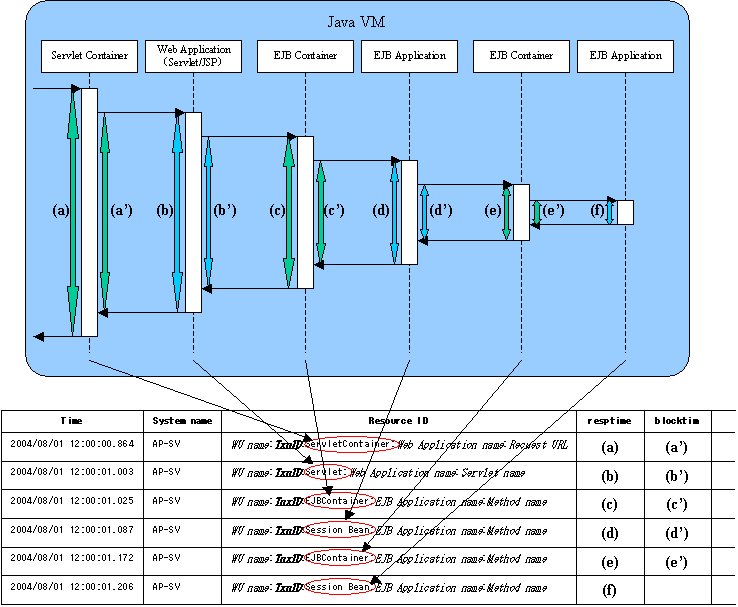
This content displays the time between the start and termination of a component as the response time, and the time between one component invoking another component and control returning to the first component as the block time. These times are displayed for each Java EE application running on each IJServer cluster or J2EE application component running on each IJServer.
Point
No block time is displayed for components that do not invoke other components.
The following screen shot shows the correspondence between the component sequence diagram and content.

When a Server Instance or a Work Unit node is selected, information about multiple transactions is displayed. Components that relate to single transactions can be identified by the ID indicated by TxnID in the resource ID.
When the node of a specific transaction ID that has been set is selected, only the information relating to the specific transaction ID will be displayed.
The resource ID format used in transaction breakdown analysis is explained below.
Resource ID format
The resource ID format for each component is shown below.
Java EE environment
Servlet container
Server Instance name: transaction ID: ServletContainer: Web application name: Requested URL |
Web application (Servlet)
Server Instance name: transaction ID: Servlet: Web application name: Servlet name |
Web application (JSP)
Server Instance name: transaction ID:JSP: Web application name: Servlet name |
EJB container
Server Instance name: transaction ID: EJBContainer: EJB application name: method name |
EJB application (Session Bean)
Server Instance name: transaction ID: SessionBean: EJB application name: method name |
EJB application (Entity Bean)
Server Instance name: transaction ID: EntityBean: EJB application name: method name |
J2EE environment
Servlet container
Work Unit name: transaction ID: ServletContainer: Web application name: Requested URL |
Web application (Servlet)
Work Unit name: transaction ID: Servlet: Web application name: Servlet name |
Web application (JSP)
Work Unit name: transaction ID:JSP: Web application name: Servlet name |
EJB container
Work Unit name: transaction ID: EJBContainer: EJB application name: method name |
EJB application (Session Bean)
Work Unit name: transaction ID: SessionBean: EJB application name: method name |
EJB application (Entity Bean)
Work Unit name: transaction ID: EntityBean: EJB application name: method name |
Note
When collecting time of multiple performance information for transaction breakdown analysis are exactly the same, display order of the performance information may be different from real calling order of components.
Transaction breakdown information that has been collected from Interstage Business Application Server, Interstage Application Framework Suite, or Interstage Business Application Server Open Java Framework can be displayed by selecting the TxnTime nodes under the main TxnAnalysis tree. There are two types of content: the analysis results over the multiple servers that execute transactions for each system group, and the breakdown analysis information for the transactions on each server.
Transaction breakdown analysis information can also be displayed for specific individual transactions by setting specific transaction IDs in the TxnIDs node under the TxnTime node.
Refer to "1.2.2.10 TxnIDs for TxnAnalysis(Sync), TxnAnalysis(Async), and TxnAnalysis(OssJava)" for details on how to set up specific transaction IDs.
Viewing transaction breakdown analysis content
This content shows information for two types of transactions: synchronous transactions and asynchronous transactions. Analysis results are displayed for each type of transaction, as shown below, including both analysis results for transactions on each separate server and analysis results for each system group over the multiple servers that execute the transactions. Analysis results are displayed for only the transactions whose processing has completed on all of the servers executing the transaction.
Synchronous transactions (Interstage Application Framework Suite and Interstage Business Application Server)
The starting time, finishing time and execution time for each individual transaction on each server
The effective transaction time and the total communication time for the transaction
A list of correspondences between SSQC transaction IDs and Interstage context IDs
Asynchronous transactions or Open Java Framework (Interstage Business Application Server)
The starting time, finishing time and execution time for each individual transaction on each server, as well as the number of activities
The effective transaction time
The starting times, finishing times and effective times for the activities in transactions
A list of correspondences between SSQC transaction IDs and Interstage context IDs
Note
Refer to "1.2.2.10 TxnIDs for TxnAnalysis(Sync), TxnAnalysis(Async), and TxnAnalysis(OssJava)" for information about "The effective transaction time and the total communication time for the transaction ", "The starting times, finishing times and effective times for the activities in transactions" and " A list of correspondences between SSQC transaction IDs and Interstage context IDs".
Term | Meaning |
|---|---|
Transaction | Business applications that are executed on Interstage are collectively referred to as "transactions". This function performs analysis processing for the state of servers while transaction control is retained by Interstage. |
Synchronous transaction | "Synchronous transactions" are transactions whose processing on Interstage is executed sequentially from start to finish. If processing requests are issued to other servers, the transaction waits for the results to be returned. Synchronous transactions can be executed using both Interstage Application Framework Suite and Interstage Business Application Server. |
Asynchronous transaction | Unlike synchronous transactions, "asynchronous transactions" return immediately, without waiting for processing requests that have been issued to other servers to return. Requested processes are placed in Interstage queues and are executed in order. Asynchronous transactions can be executed using Interstage Business Application Server only. |
Context ID | "Context ID" refers to the context ID section in the standard log. |
Correlation ID | Refers to Correlation ID part within standard log. |
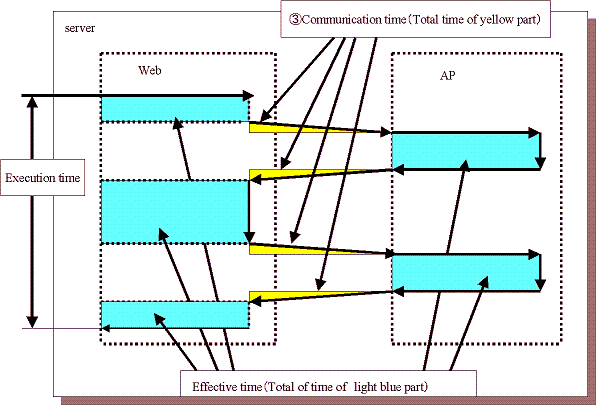
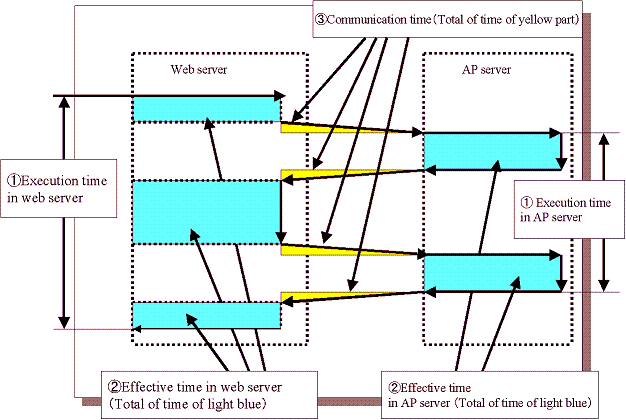
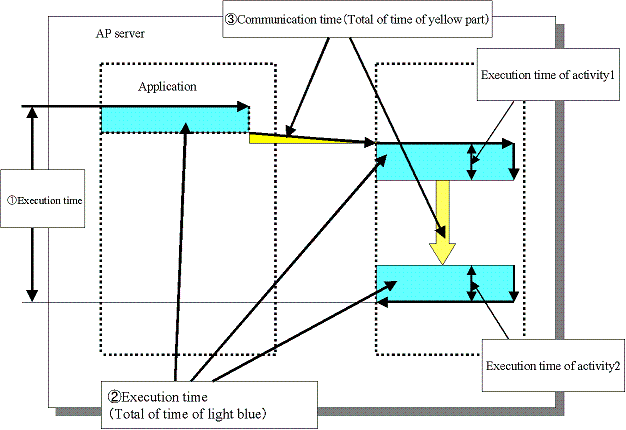
Transaction execution time | For synchronous transactions, "transaction execution time" refers to the total time taken from the time when a transaction is called to the time when it returns, Accordingly, if a transaction passes through multiple servers, the time taken to pass through these servers is also counted as the execution time for the server that made the original call. For asynchronous transactions, "transaction execution time" refers to the total time taken from the time when a transaction is called to the time when all activities complete. (Part (3) in the following diagrams) |
Effective transaction time | "Effective transaction time" refers to the time that a transaction spends actually running on a server. Accordingly, for synchronous transactions, if a processing request is issued to another server, neither communication time nor the time that a transaction spends executing on the other server are not counted as effective time. (Part (2) in the following diagrams) |
Communication time | "Communication time" is the time that a transaction spends making processing requests and receiving processing results. (Part (3) in the following diagrams) |
Note
"Context ID" is a term that is used with synchronous transactions. For asynchronous transactions, the term "correlation ID" is used.
Representation of execution time, effective time and communication time for a synchronous transaction (where the transaction is executed within a single server)

Representation of execution time, effective time and communication time for a synchronous transaction (where the transaction is executed over multiple servers)

Representation of execution time and effective time for an asynchronous transaction or Open Java Framework

With the open Java framework, the processes performed by each of the subsystems (Struts, Spring, iBATIS) are treated as activities. The breakdown for each activity is displayed below:
Activity | Description | Applicable Log Output Occasion (message ID) |
|---|---|---|
Model | M in the MVC model. Performs processes related to data and procedures. | Action-Class(8501) Spring-Controller(8542) Controller-Class(8543) Spring-Remote-App(8547) |
View | V in the MVC model. Performs processes related to display and output | Struts-View(8502) Spring-View(8544) |
Controller | C in the MVC model. Responds to user input, and performs distribution to Model and View. | ActionServlet(8500) Spring-MVC(8541) |
Validator | Checks values entered by the user. | Struts-Validator(8503) Spring-Validator(8545) |
DB Access | Input-output of data to and from databases. | iBATIS(8581) |
Remote (communication time) | Time required for network communication for Spring remote processing. | Spring-Remote(8546) |
Analyze the transactions from each performance log and the execution time, effective time, and communication time for each activity, and collect transaction performance information.
Information
The definitions for execution time, effective time, and communication time are as follows:
Execution time: Time taken from invocation of a transaction until completion of all activities.
Effective time: Time during which activities are actually running on the server.
Communication time: Time taken for the communication to request processing and receive results in a transaction