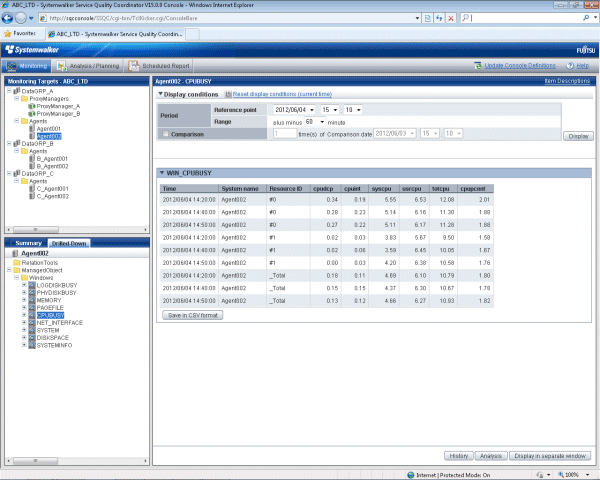
To display detailed content, select an item from the display targets in the Drilled-Down tree on the left, specify the options at the top of the right window and then click the Display button.
While the content is being generated, the message "Loading..." appears in the content display area.
While this message is displayed, the Display button will be disabled.
option
The following table lists the options that can be specified.
Option | Description |
|---|---|
Reference point | Select the time that will be used as the starting point for the Drilled-Down display. A time up to one week prior to the present time can be selected. The current time is selected by default when the window is opened. |
Range | This option is used to select how many minutes either side of the starting point will be used as the Drilled-Down display's range. The following display ranges can be selected: 180, 120, 60, 30, 10 and 0 minutes The default is 60 minutes. If "0" (minutes) is selected, the time specified in the Date option will be indicated by a pinpoint. |
Comparison date | Comparison Put a check here if the Drilled-Down display is to be compared. Specify a real number between 0.001 and 1000 for the multiplying factor. When a factor greater than 1 is specified, the information is emphasized if the data from the specified period is greater than that from the comparison date when multiplied by the factor. When a factor less than 1 is specified (between 0.999 and 0.001), the information is emphasized if the data from the specified period is less than that from the comparison date when multiplied by the factor. Note As for the following Drilled-Down display items, this function is off the subject. ResponseCondition TxnAnalysis(Sync) TxnAnalysis(Async) TxnAnalysis(OssJava) Workload |
To remove the need to specify the same option many times, once an option is specified, it is inherited by other Drilled-Down displays.
By clicking on the Display in separate window button in the lower right of the Drilled-Down display window, the Drilled-Down display content in the current view is opened in a separate window.
This makes it possible to display other items in the console for comparison.
When the window is displayed separately, that window can then be printed by clicking the Print button.
When the History button at the bottom right of the Drilled-Down display is clicked, the Drilled-Down history list window is displayed showing the details from the past two hours.
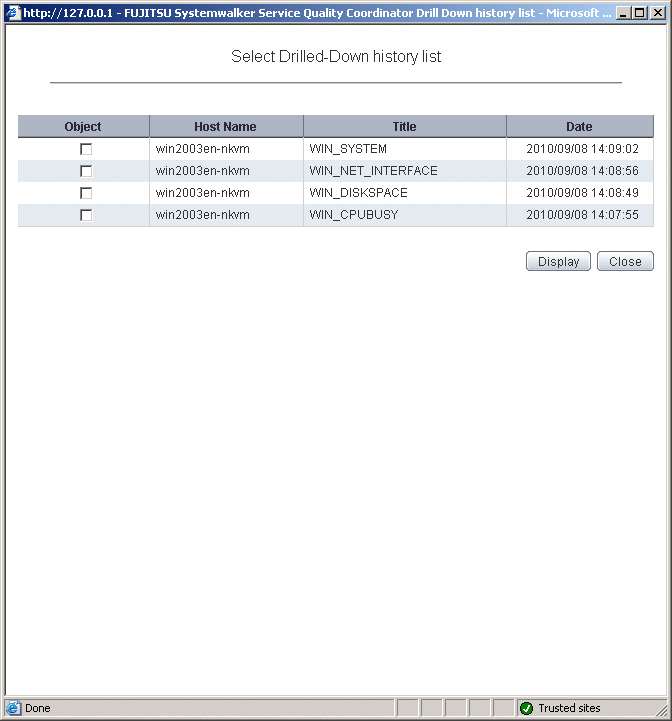
By selecting any of the check boxes shown in the list and clicking the Show button, the selected Drilled-Down display content can be displayed in a single window.
This enables multiple items to be listed together and compared.
Some of the nodes in the ManagedObject folder created automatically by collecting configuration information contain a Resources folder.
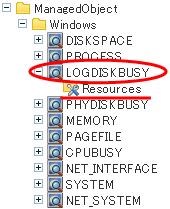
By defining resources for this type of node, the user can display. By defining resources for this type of node, the user can display the content of specific resources in the Drilled-Down display.
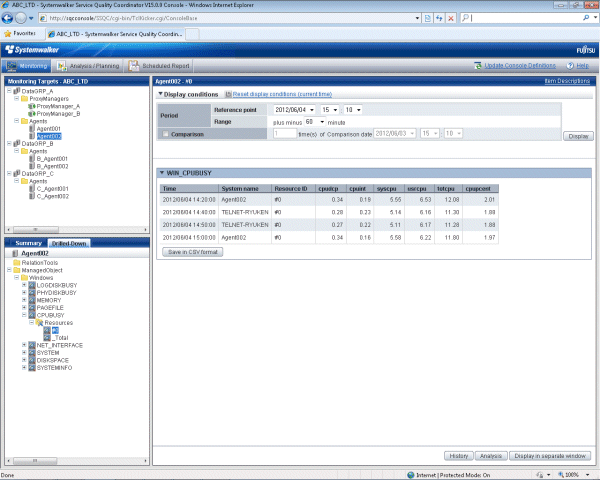
This is an example of the Drilled-Down display content displayed when the WIN_CPUBUSY node is selected.

Registering "Resource #0" as a resource node enables content to be displayed by targeting only "#0".
Refer to "1.2.2.5 Resources" for details on how to define resources.
If the RelationTools node is selected in the Drilled-Down tree, it is possible to invoke related tools that are registered with the Setting view.
Refer to "1.2.2.4 RelationTools" for details on how to define related tools.