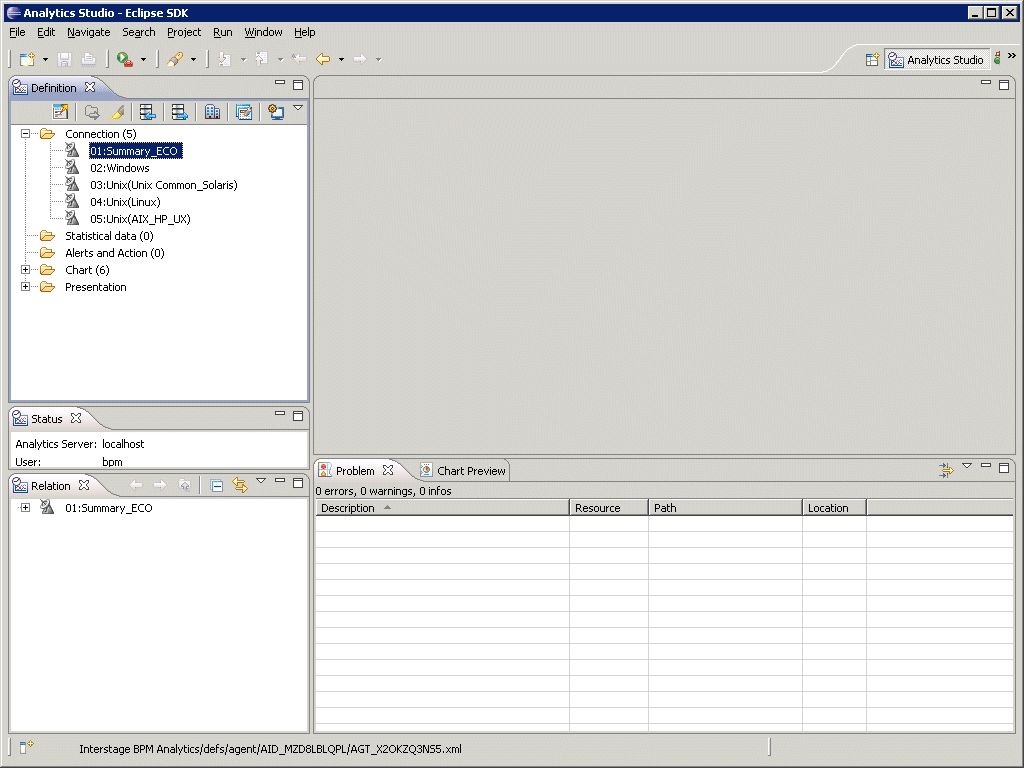
Use the Analytics Studio to customize the Systemwalker Service Quality Coordinator dashboard templates.
Point
For more detailed information on how to use the Analytics Studio (customizing charts and views, etc.), refer to the Interstage Business Process Manager Analytics V11.1 Studio Guide.
Note
The connection information name "01:Summary_ECO" appears as an example in images throughout this chapter. However, the actual names that appear on working screens will depend on the template used in each case.
There are different templates for the various items that need to be managed.
Refer to the following table to identify the template that includes the information you need:
Template name | Connection information name | Information collected | Remarks |
|---|---|---|---|
01-StandardTemplate | 01:Summary_ECO | ServerMonitor | |
ZoneMonitor/ZoneStackMonitor/ZoneStackMonitor(All) | |||
ECO folder/ECO reports | |||
02:Windows | Windows folder/Windows reports | ||
03:Unix(Unix Common_Solaris) | Solaris & Linux folder / UNIX reports | Records with the Record ID "UX_xxx" are defined from amongst the collected information. | |
04:Unix(Linux) | Solaris & Linux folder / UNIX reports | Records with the Record ID "LX_xxx" are defined from amongst the collected information. | |
05:Unix(AIX_HP_UX) | Solaris & Linux folder / UNIX reports | Records with the Record ID "AX_xxx" and "HP_xxx" are defined from amongst the collected information. | |
02-VirtualMachineTemplate | 06:Virtual server (VMWare ESX / VMWare ESXi) | Vmware(Virtual)StackMonitor | |
Vmware(Physical)Monitor | |||
Vmware folder/Vmware reports | |||
07:Virtual server (Hyper-V) | HyperV(Virtual)StackMonitor | ||
HyperV(Physical)Monitor | |||
Hyper-V folder/Hyper-V reports | |||
08:Virtual server (Xen) | Xen(Virtual)StackMonitor | ||
Xen folder/Xen reports | |||
03-Response&ServiceTemplate | 09:Response_Service | UserResponseMonitor | |
ServiceAvailMonitor | |||
WebTrnMonitor | |||
ResponseCondition folder/End user response reports | |||
ServiceCondition folder/HTTP/DNS/SMTP/PORT service reports | |||
WebTrn folder/Web transaction reports | |||
04-Network&StorageTemplate | 10:Network | TcpNetworkMonitor | |
No data/Systemwalker Network Manager reports | |||
TcpNetwork folder/TcpNetwork report | |||
11:Storagemonitor | StorageMonitor | ||
StorageResource folder/Storage reports | |||
05-FujitsuMiddlewareTemplate | 12:Systemwalker | OperationMgrMonitor | |
No data/CentricManager reports | |||
OperationMgr folder/OperationManager reports | |||
13:Interstage (summary) | Interstage(EJB)Monitor | ||
Interstage(TD)Monitor | |||
Interstage(CORBA)Monitor | |||
Interstage(IJServer)Monitor | |||
TxnSyncMonitor | |||
TxnAsyncMonitor | |||
ISI SequenceMonitor | |||
ISI QueueMonitor | |||
14:Interstage (detailed) | Interstage folder/Interstage reports | ||
Interstage(TxnAnalysis) folder/no reports | |||
TxnAnalysis(Sync) folder/no reports | |||
TxnAnalysis(Async) folder/no reports | |||
ISI folder/ISI reports | |||
06-DatabaseTemplate | 15:SymfoWARE | SymfowareMonitor | |
Symfoware folder/Symfoware reports | |||
16:Oracle | OracleMonitor | ||
Oracle folder/Oracle reports | |||
17:MS-SQL | MS-SQL_Monitor | ||
07-MiddlewareTemplate | 18:MS-NET | MS-.NET_Monitor | |
MS-.NET folder/MS-.NET reports | |||
19:SAP | SAP Monitor | ||
SAP folder/SAP reports | |||
08-UserdataTemplate | 20:UserDataMonitor | UserDataMonitor | |
21:UserData | UserData folder/Detailed report (UDATA1 to 20) |
Refer to "3.3.3 Applying Analytics Studio Definitions" for how to apply the templates.
Note
Agent performance information that can be collected by the Dashboard Server is as follows.
Summary data
Resource data (10 minutes)
By specifying the Agents to be monitored, only data from those agents is transferred to the Dashboard Server. This prevents the Dashboard Server from being overloaded with information.
Procedure
In the Analytics Studio's Definition view, select Connection >> 01:Summary_ECO.

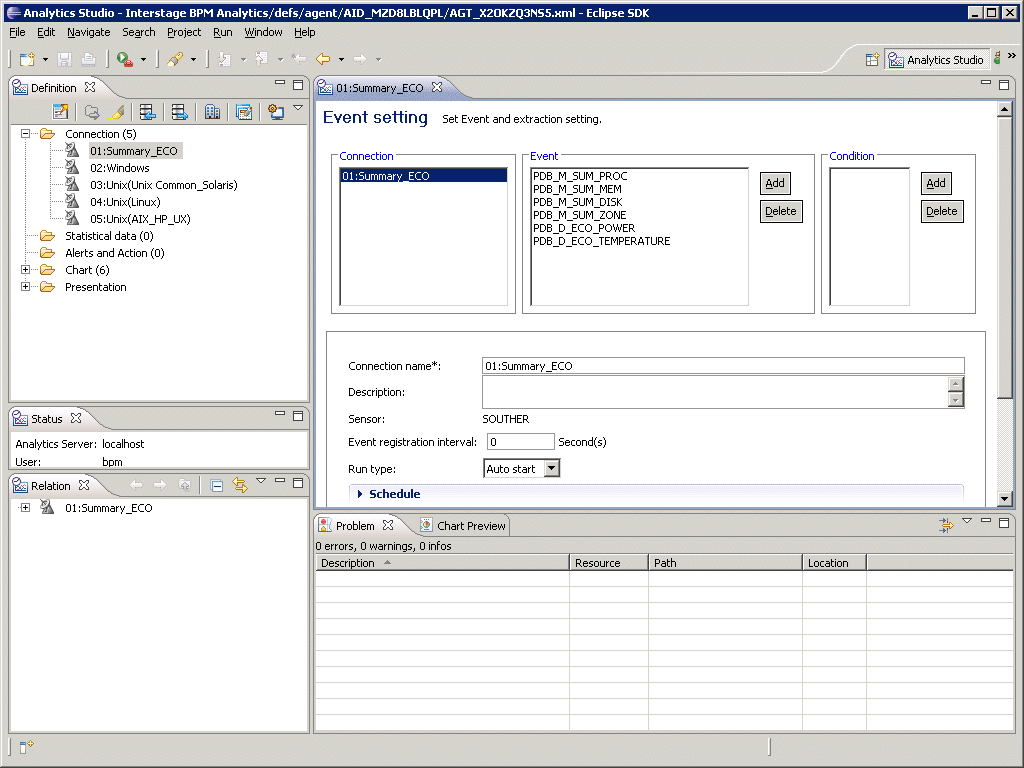
The "01:Summary_ECO" view appears, next select Connection Information >> 01:Summary_ECO.

Enter the IP addresses of the Agents you want to monitor with the Dashboard in the text box next to TargetServerNameList*: under PDBSensorConf. To enter multiple Agents for monitoring, separate each individual IP address with commas.
Note
For agent for Agentless Monitoring and virtualized software (Vmware, Hyper-V, Xen), rather than entering an IP address, enter the DISPLAYNAME (or HOSTNAME if there is no DISPLAYNAME) in the remote monitoring configuration file created by the Manager/Proxy Manager.
Point
By default, an asterisk is entered in the PDBSensorConf >> TargetServerNameList*: text box. This asterisk indicates that performance information from all Agents in the PDB has been obtained.
To specify the Agents from which performance information is collected, enter their host names or IP addresses (up to 43,644 alphanumeric characters in length). Use the asterisk (*) wildcard character to extend the host names or IP addresses by one or more characters to the right and/or left.
Examples are shown below:
"Win*" entered Host names beginning with "Win" are specified
"*dows" entered Host names ending with "dows" are specified
"*ndo*" entered Host names including "ndo" are specified
"192.168.0.*" Agents with IP addresses between 192.168.0.0 and 192.168.0.255 are specified
Select the Definition view in Upload to Server to upload the changed definition information in the Dashboard Server.
This section describes how to change the collection interval for the monitored data that the Dashboard Server collects from the Manager.
Note
Do not change the collection interval to one smaller than the default setting (10 minutes) or else the Dashboard Server may become overloaded and unable to collect data correctly.
Procedure
Select 01:Summary_ECO from the Analytics Studio's Definition view.
Select the event for which the data collection interval is to be changed from the "01:Summary_ECO" view.
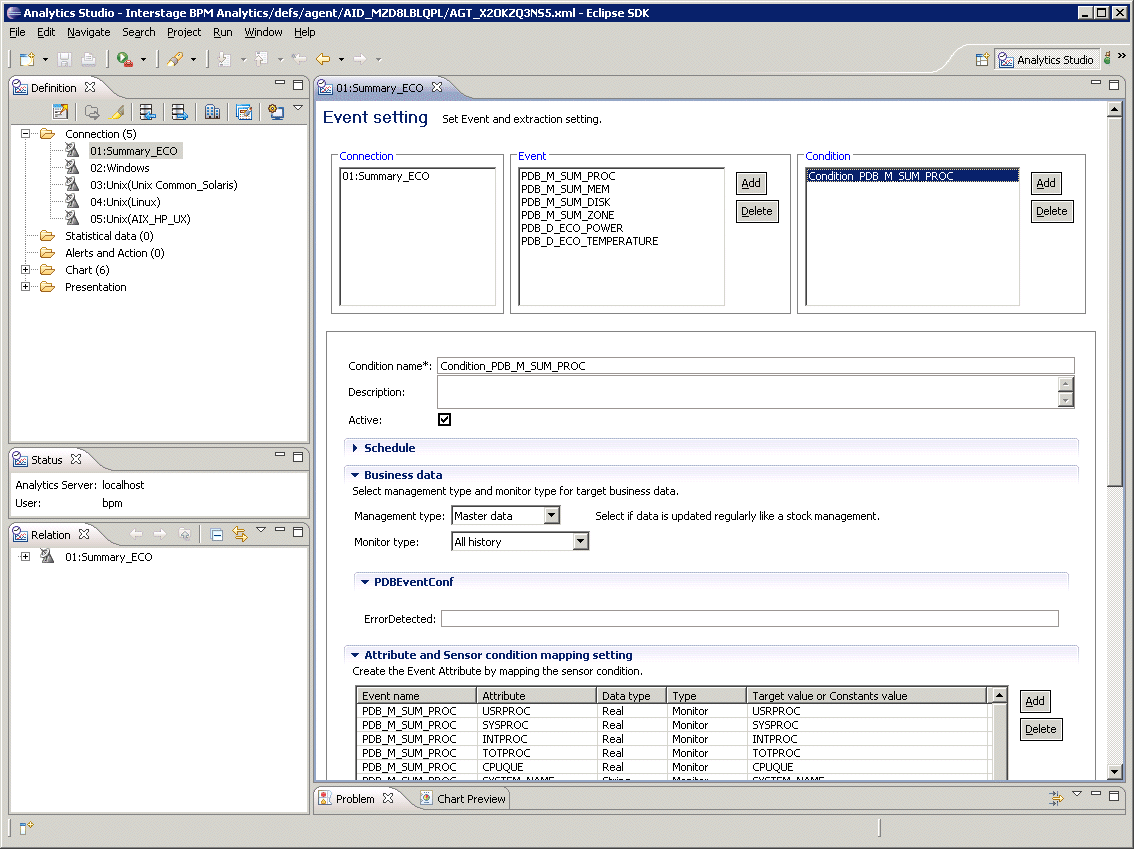
Select Condition_<event name> from Collection Condition.
In the Schedule >> Schedule Setting >> Interval column, change the time to the data collection interval you want.
Select the Definition view in Upload to Server to upload the changed definition information into the Dashboard Server.
The following events are enabled as monitored items in the Systemwalker Service Quality Coordinator Dashboard template (01-StandardTemplate) and performance information for them is transferred from the Manager to the Dashboard Server.
Event name | Remarks |
|---|---|
PDB_M_SUM_PROC | Monitor information (CPU) |
PDB_M_SUM_MEM | Monitor information (memory) |
PDB_M_SUM_DISK | Monitor information (disk) |
PDB_D_ECO_POWER | Power consumption |
PDB_D_ECO_TEMPERATURE | Temperature |
To add other events, refer to "4.1.3.1 Dashboard template". After applying the required template, do the following processes:
Note
When you want to add an event to be monitored or apply a new Dashboard template, you must go to Sensor Management in the Interstage Business Process Manager Analytics Management Console and stop all Connection Information instances whose connection type is "PDB". Trying to add a monitored event, or to apply and upload a template, while these instances are running can take a great deal of time.
When you need to apply more than one Dashboard template, make sure you go through the procedure of applying the template, uploading it, and saving the changes to the definition in the Dashboard Server for one template at a time. Trying to apply and upload more than one template at once can take a great deal of time.
Procedure
In the Analytics Studio's Definition view, select Connection >> 01:Summary_ECO.

The "01:Summary_ECO" view is displayed, select Event >> <event name>.

Select Collection Condition >> Condition_<event name>.
Check the Active check box.
Select the Definition view in Upload to Server to upload the changed definition information into the Dashboard Server.
Use the Interstage Business Process Manager Analytics Management Console to restart the Interstage Business Process Manager Analytics Server and activate the sensor connection information (01:Summary_ECO in this example).
After logging into the Management Console, click the BPM Analytics System >> Server Management >> BPM Analytics Server tab, then in the screen that appears to the right, click the Re-Start to restart.
To activate the connection information (01:Summary_ECO), after logging into the Management Console, select Sensor Management >> <sensor name> and check the Connection Information name checkbox "01:Summary_ECO" and click the Start.
Point
Stop event information that does not need to be monitored from being transferred to the Dashboard Server by unchecking the Active check box.
Use account management to define access rights to the Dashboard.
Register people who will be using the Dashboard for monitoring as Dashboard users.
By creating roles and associating them with the users created in user management, access to the Dashboard can be managed.
Roles
It is necessary to grant access rights to users so that they can use the Dashboard. If a user has been granted rights corresponding to a certain ID, then that user can see the Dashboard for that event. These rights of access are referred to as 'roles'.
Guest role
Each system can have one guest role so that a user who does not belong to any particular role will belong to the guest role. A user cannot belong to both a particular role and the guest role.
User Registration procedure
In the Analytics Studio's Definition view, select Launch Wizards.
Select the Analytics wizard's Presentation.
In the Create Dashboard window, select Create User and click the OK.
The Create User window is displayed. Enter a user ID, user name, and password and click the OK button.
Procedure for creating roles
In the Analytics Studio's Definition view, select Launch Wizards.
Select the Analytics wizard's Presentation.
In the Create Dashboard window, select Create Role and click the OK.
The Create Role window is displayed. Make the user settings and select the View Profile that the role can have access to and click the OK.
For details, see the Interstage Business Process Manager Analytics V11.1Studio Guide.