This view is used to display all the devices that are registered on the resource view. The category icons of the managed devices are displayed.
When a device is connected with a Fibre Channel, a physical connection line is automatically displayed. Even if two physical Fibre Channel cables are connected, one line is indicated.
By clicking [View] - [Refresh], the latest SAN status of all devices is loaded and displayed.
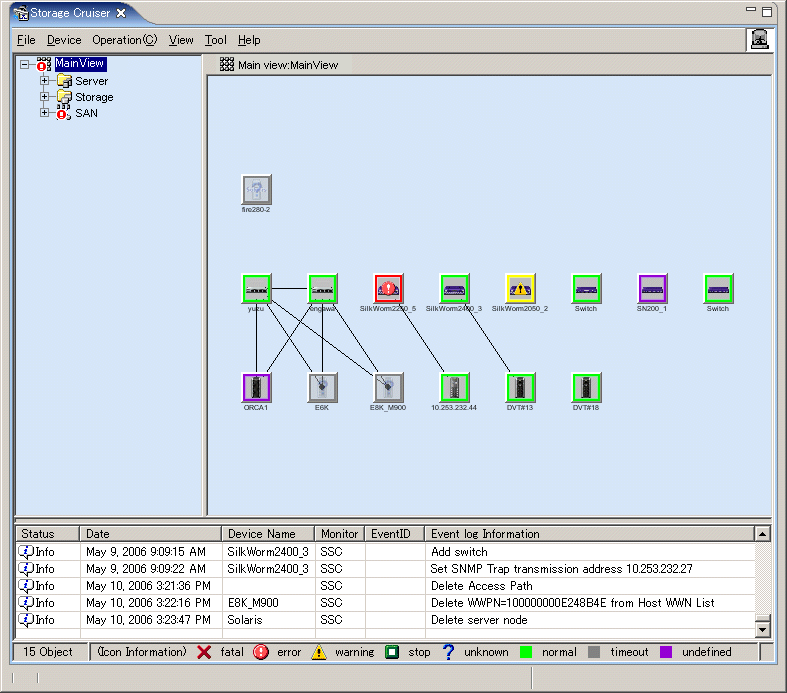
Each device icon can be freely positioned. It should be positioned in an easy-to-manage location. The device icon in each view is displayed depending on the device status as follows.
Icon state | Color | Icon | Description | Action to be taken |
|---|---|---|---|---|
normal | Green | The device is operating normally. | None | |
warning | Yellow |
| An attention-level error was detected in the device. Resources can be available. | Replace the faulty part, and execute recovery processing. -> "8.1 Windows Displayed in the Event of a Fault and Troubleshooting" |
error | Red |
| An error was detected in the device though the cause is not found. Resources are not available. | Replace the faulty part, and execute recovery processing. -> "8.1 Windows Displayed in the Event of a Fault and Troubleshooting" |
stop | Green |
| Stop status. | None |
fatal | Red |
| Faulty parts are detected in this resource. Resources are not available. | None |
unknown | Grey |
| Status unknown | None |
timeout | Gray | The device is defined in this software, but it cannot recognize it. The device properties displayed by the GUI are the values that were retrieved the last time that the device was recognized. However, if the device is a Fibre Channel switch that enters the timeout state, the GUI does not display the Fibre Channel physical line under the Fibre Channel switch. The GUI indicates errors for all access paths using the Fibre Channel switch because this software cannot check the statuses of these paths. | The power supply of the device may be off or Agent may not be operating; also, a LAN error may have occurred. If you changed the IP addresses manually, also refer to "9.1.2 Changing the operating environment" and perform operations to reflect the changes of the IP addresses. If the device uses the SNMP protocol for communication, the community name of the device may differ between the target device and admin server. If the community name of the target device has been changed, set the community name by referring to "C.2 sanma.conf Parameter", and reflect the setting file on this software. -> Check the device status, and select [Refresh] from the menu. | |
undefined | Violet | The device is undefined in this software. | Define the device. |
Revolving light icon lights when there is a change in the state of the displayed device. Revolving light icon is displayed as follows:
Icon (Color) | State | Description | Action to be taken |
|---|---|---|---|
| Information | The state change occurs. | Click the revolving light icon and update to latest information. |
| Warning | The trouble at the warning level occurs. | Click the revolving light icon and update to latest information and recover. -> "8.1 Windows Displayed in the Event of a Fault and Troubleshooting" |
| Error | The trouble occurs. | Click the revolving light icon and update to latest information and recover. -> "8.1 Windows Displayed in the Event of a Fault and Troubleshooting" |
| Normal | There is no state change. | None. |
This software automatically analyzes and displays the connection status of each Fibre Channel physical line between devices, such as that between a server node and a Fibre Channel switch and that between a Fibre Channel switch and storage.
The current version of this software automatically displays the connection status of Fibre Channel physical lines between the devices listed in the following table.
HBA | Solaris OS | Windows | Linux | HP-UX | ||
|---|---|---|---|---|---|---|
PW008FC2A, | LP-9000, | PG-FCD101, | LP-9000, | PG-FC105, | A6795A, AB378B, | |
Fibre Channel switch | Yes | Yes | Yes | Yes | Yes | Yes |
Fibre Channel hub | Yes (*1) | No | Yes (*1) | No | No | No |
One-to-one connection | Yes | No | Yes | No | No | No |
*1: These are converted to individual lines connecting several HBAs and a CA.
Information
For VMware Infrastructure 3 Version 3.5 (or later) or VMware ESXi 3.5 (or later) environment:
Displaying the device status
The device status of VM host and VM guest is displayed as an icon. On the Main view and Domain view, the device status for both VM host and VM guest is displayed in the VM host icon.
For details of the device status, refer to "Device Status" of "B.7.2 Server node (VM host) properties" or "Device Status" of "B.7.3 Server node (VM guest) properties".
View | Displaying the device status | |||||||||||||||
|---|---|---|---|---|---|---|---|---|---|---|---|---|---|---|---|---|
Main view | VM host | Displays by using an icon of VM host.
The display examples are as follows. [Display example 1]
The status of VM host is "warning" ( [Display example 2]
The status of VM host is "normal", and the status of VM guest is "unknown" ( The device status of VM host is not influenced by the device status of VM guest. For example, the icon of VM host is displayed as "normal" (green color) when the status of VM host is "normal" and the status of VM guest is "error". In this case, the icon of VM host is not displayed as "error" (red color). The icon of VM host is displayed as "normal" (green color) and | ||||||||||||||
VM guest | The device status of VM guest is displayed on the right-bottom in the icon of VM host. | |||||||||||||||
Side view | VM host | Displays by using an icon of VM host. | ||||||||||||||
VM guest | Displays by using an icon of VM guest. | |||||||||||||||
Tree | VM host | Displays by using an icon of VM host. | ||||||||||||||
VM guest | Displays by using an icon of VM guest. | |||||||||||||||
List view | VM host | Displays in "Device Status" of the display items. | ||||||||||||||
VM guest | Not displays the VM guest information. | |||||||||||||||
Tree
The VM host is displayed under the [MainView] - [Server] - [Base domain]. The VM guests are displayed under the VM host that manages their VM guests.

The status of VM guest is displayed according to the display priority level of the upper class (MainView, Server and Base domain) without VM host. The order of the display priority level is "error", "warning", "unknown" and "normal".
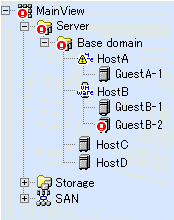
In the above case, the status of the upper class for the VM guest (GuestB-2) is as follows.
Class | Status |
|---|---|
VM guest (GuestB-2) | The status is "error". This information is not reflected on VM host (HostB). |
VM host (HostB) | Displays the status of VM host only. The status of VM guests managed by this VM host is not reflected. |
Base domain | Displays the highest priority level in the VM host (HostA , HostB) and VM guest (GuestA-1, GuestB-1, GuestB-2) and host (HostC, HostD). |
Server | The status of the Base domain is reflected. |
MainView | Displays the highest priority level in the "Server" and "Storage" and "SAN". |