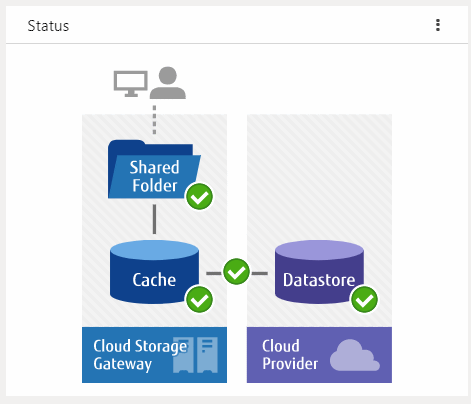
The status is displayed on the Status panel of the CSG Web GUI dashboard.
Figure 4.3 Example of Information Displayed on the Status Panel

The statuses of the shared folders, cache, datastores, and networks are displayed on this panel.
Icon | Meaning |
|---|---|
| Normal operation. |
| This product is operating, but your attention is required. For example, the used cache capacity is approaching the threshold value. Refer to "Appendix B Status Information" for details. |
| An error has occurred and the operation has stopped. Check the Logs panel and take appropriate action. |
| Unable to acquire the status information. |
| A cloud provider, a datastore, or a shared folder has not been defined. For example, when the dashboard is in the initial state. |