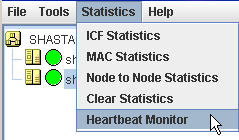
To display the Heartbeat monitor, go to the Statistics menu and select Heartbeat Monitor (see below.)
Figure 4.23 Selecting the Heartbeat monitor

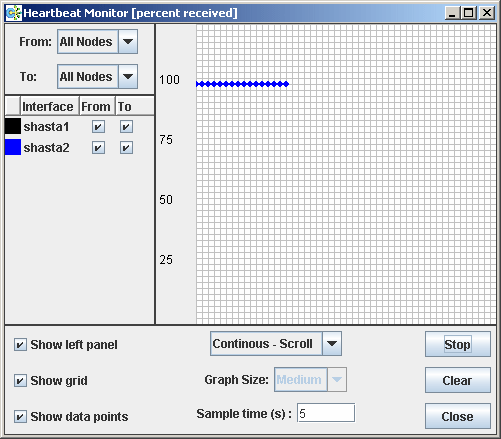
The Heartbeat monitor allows you to monitor the percentage of heartbeats that are being received by CF over time. On a healthy cluster, this is normally close to 100 percent.
The Y axis is the percentage of heartbeats that have been successfully received and the X axis is a configurable time interval (see below.)
Figure 4.24 Heartbeat monitor

The controls on the left panel determine which data the graph shows as follows:
The selection boxes at the top can be set to an individual node, or to All Nodes.
The check boxes below the selection boxes allow the enabling and disabling of specific nodes.
The controls on the left of the bottom panel control how the graphing and information collection is done as follows:
The Show left panel check box hides the left panel to provide more room for the graph.
The Show grid check box turns the grid on and off.
The Show data points check box can be turned off to display a simple line graph.
The controls in the bottom panel are as follows:
The drop-down menu below the graph controls how the graph is drawn. The following options are available:
Continuous-Scroll - creates a continuous graph, so that when there are more data points than space, the graph scrolls.
Continuous-Clear - graphs continuously, but when the graph is full, clears it and starts a new graph.
Single Graph - creates a single graph only.
Graph size - allows you to control how many data points are drawn.
Sample time - controls how often data points are taken.
The buttons on the lower right control starting and stopping of the graph, clearing it, and closing the graph window.