To examine and diagnose physical connectivity in the cluster, select
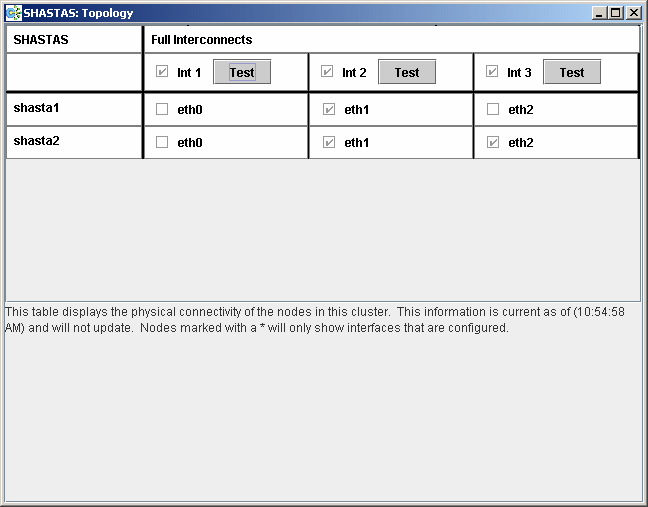
Tools -> Topology. This menu option will produce a display of the physical connections in the cluster. This produces a table with the nodes shown along the left side and the interconnects of the cluster shown along the top. Each cell of the table lists the interfaces on that node connected to the interconnect. There is also a checkbox next to each interface showing if it is being used by CF. This table makes it easy to locate cabling errors or configuration problems at a glance.
This is the example of the topology table.

Pressing the Test button launches the Response Time monitor.
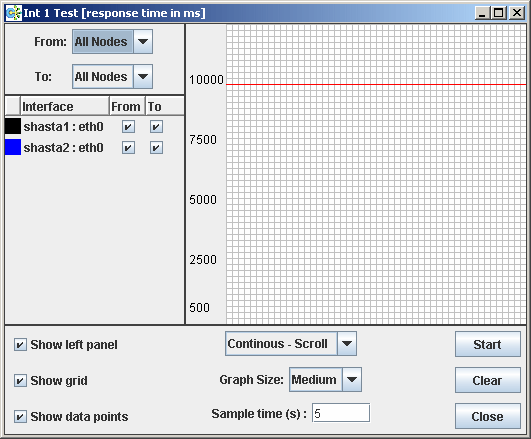
This tool allows you to see the response time for any combination of two nodes on that interconnect (see the following.).
Figure 4.10 Response Time monitor

The Y axis is the response time for CF pings in milliseconds and the X axis is a configurable period. The red line is the upper limit of the response time before CF will declare nodes to be in the LEFTCLUSTER state.
The controls to the left of the graph determine the nodes for which the graph displays data as follows:
Set the selection boxes at the top to a specific node name, or to All Nodes.
Select the check boxes next to the node names to specify specific nodes.
The controls on the left of the bottom panel control how the graphing and information collection is done as follows:
Check the Show left panel check box to hide the left panel to provide more room for the graph.
Check the Show grid check box to turn the grid on and off.
Check the Show data points check box to display a simple line graph.
The controls in the middle of the bottom panel are as follows:
The top drop-down menu controls how the graph is drawn. The following options are available:
Continuous-Scroll - Creates a continuous graph, so that when there are more data points than space, the graph scrolls.
Continuous-Clear - Graphs continuously until the graph is full, and then it starts a new graph.
Single Graph - Draws a single graph only.
Graph size - Allows you to control how many data points are drawn.
Sample time - Controls how often data points are taken.
The buttons on the lower right control starting and stopping of the graph, clearing it, and closing the graph window.
The buttons on the right of the bottom panel are as follows:
Start/Stop - Starts or stops the Response Time Monitor.
Clear - Clears the data and starts a new graph.
Close - Closes the Response Time Monitor and returns you to the CF Main screen.
Note
The Response Time Monitor is a tool for expert users such as consultants or skilled customers. Its output must be interpreted carefully. The Response Time Monitor uses user-space CF pings to collect its data. If the CF traffic between nodes in a cluster is heavy, then the Response Time Monitor may show slow response times, even if the cluster and the interconnects are working properly. Likewise, if a user does CF pings from the command line while the Response Time Monitor is running, then the data may be skewed.
For best results, the Response Time Monitor should be run at times when CF traffic is relatively light, and the CF nodes are only lightly loaded.