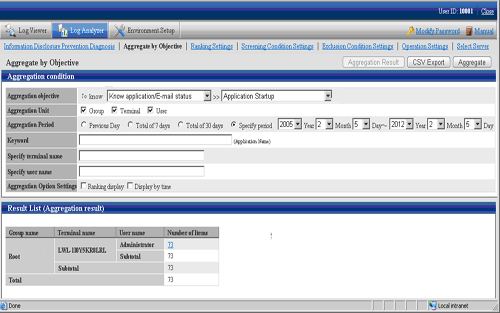
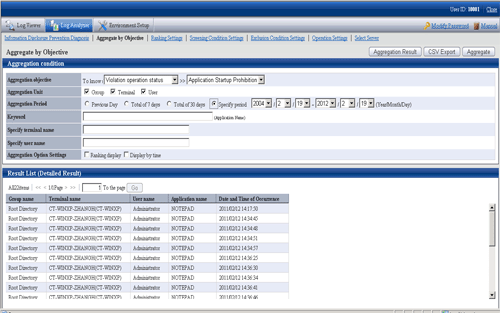
After selecting aggregation content corresponding to the objective, setting the conditions such as aggregation unit, aggregation period and keywords and performing log aggregation, the result can be displayed.
Point
When there are many target data, the process of displaying Aggregation Result and Result Details may take a long time and browser timeout may occur (aggregation condition and the performance of the Management Server will also affect the processing time).
Standard of Processing Time:
To know printing operation status - during printing operation (frequency), 4.2 million cases require about 27 seconds
To know file operation status - during file operation, 3.4 million cases require about 24 seconds
To know Web access status - during the Window title obtaining with URL, 23 million cases require about 81 seconds
When accessing the Management Server through a proxy, timeout may occur due to the proxy. In this case, timeout can be prevented if accessing the Management Server without using a proxy according to the following procedure.
Set the address of Management Server in Do not Use Proxy to Access the Following Addresses of Tool > Internet Options > Connection > LAN Settings > Details.
When a large amount of information such as a large amount of log lists and aggregation results without 24 hours are displayed in a window, it may take some time to display the result. Before the result is displayed properly, blank page may appear with only part of tables being displayed or flashing, and it looks like the page may collapse. In addition, when a large amount of information is displayed, the response of the button and browser resizing may be delayed.
The "Audit Success" and "Audit Failure" statuses may be output as below to the event log (security) on the Log Analyzer Server during the Count by Purpose operation, but there is no impact to the operation.
Audit Success
Event ID: 4648
Event ID: 4634
Event ID: 4624
Event ID: 4672
Audit Failure
Event ID: 4776
Aggregate
The procedure is as follows:
After confirming that it is not in data transfer, select Aggregate by Objective from the function menu.
The Aggregate by Objective window is displayed.

Aggregation condition
The list of log aggregation objectives is displayed.
After each objective is selected, the detailed menu (objective) is displayed.
Set aggregation unit, aggregation period and keywords, etc.
Result List
The aggregation result is displayed.
In Aggregation objective, select an aggregation objective and its sub-menu.
Aggregation Objective | Sub-menu of Aggregation Objective | Content |
|---|---|---|
To know Violation operation status | Application Startup Prohibition | Aggregate the number corresponding to application startup prohibition. |
Printing Prohibition | Aggregate the number corresponding to printing prohibition. | |
Logon Prohibition | Aggregate the number corresponding to logon prohibition. | |
PrintScreen key Prohibition | Aggregate the number corresponding to PrintScreen key prohibition. | |
E-mail Attachment Prohibition | Aggregate the number corresponding to E-mail attachment prohibition. | |
To know File export status | File Export | Aggregate the number of file export. |
File Export (by drive) | Aggregate the number of file export by the type of target drive as export destination. | |
To know File operation status | File Operation | Aggregate the number of file operation. |
File Operation (Remote) | Aggregate the number of file operation on network. | |
File Operation (Removable) | Aggregate the number of file operation on removable media. | |
To know Application/ E-mail status | Application Startup | Aggregate the number of application startup. |
E-Mail Sending by Recipient Address | Aggregate the number of E-mail sending, | |
To know Printing operation status | Printing Operation (times) | Aggregate the number of printing. |
Printing Operation (Number of Pages) | Aggregate the total number of printed pages. | |
To know Web access status | Window Title with URL Obtaining | Aggregate the number of internet access. |
Window Title with URL (by site) Obtaining | Aggregate the number of Internet access by site. | |
To know Information disclosure status | File Export | Filter logs according to filtering condition/exclusion condition and aggregate the number of file export for external media. |
File Operation | Filter logs according to filtering condition/exclusion condition and aggregate the number of file operation for external media. | |
Printing Operation (Times) | Filter logs according to filtering condition/exclusion condition and aggregate the number of printing. | |
Printing Operation (Number of Pages) | Filter logs according to filtering condition/exclusion condition and aggregate the total number of printed pages. | |
E-mail Sending by Recipient Address | Filter logs according to filtering condition/exclusion condition and aggregate the number of E-mail sending. | |
FTP operation (upload) | Filter logs according to filtering condition/exclusion condition and aggregate the number of FTP uploads. | |
Web operation (upload) | Filter logs according to filtering condition/exclusion condition and aggregate the number of Web uploads. |
Set the following items.
The setting items and configuration values are shown as follows.
Item Name | Description |
|---|---|
Aggregation Unit | Specify the unit for aggregation. Multiple units can be selected.
When multiple units are selected, the relationship between units is in sequence of Group > Terminal > User. It is displayed from the left in large to small order.
|
Aggregation Period | Specify the collection date for logs to be aggregated.
When a large target of data that requires a long aggregation period exists like Total of 30 days and Specify period, a certain amount of processing time may be consumed, so it may not be able to display properly after timeout occurs. Aggregate by weeks and set appropriate value in aggregation period. |
Keyword | Specify the keyword for search during aggregation. Specify up to 50 characters (no distinction between halfwidth and fullwidth). |
Specify terminal name | Aggregate the logs that contain the specified computer name (partially match). |
Specify user name | Aggregate the logs that contain the specified user name (partially match). |
Aggregation Option Settings | Specify the display format of the aggregation result.
|
Click the Aggregate button.
Aggregate by objectives cannot be used by multiple users at the same time.
When another user has already obtained the aggregation result or the aggregation process is being executed, the following message will be displayed:
Aggregation function may be in use by another user. Do you want to continue?
When another user has already obtained the aggregation result, after clicking the OK button, the aggregation will be executed while the aggregation result of another user will be aborted.
When another user is performing the aggregation process, an error message will be displayed, and execution cannot be performed until the other user finishes the processing.
In the process of aggregation or cancellation of aggregation, do not execute the following operations. If the execution is started, the uncompleted processing will be remained and processing may not be able to be performed in a certain time.
Move to windows displayed in Global Navigation and function menu
Logout operation
Window operation based on browser functions (Close, Back, Update, etc.)

The name of the aggregation unit (Group, Terminal, User) is displayed in the left column of the table.
The root group in the CT group tree of Management Console will be displayed as "Root" in Group name.
In addition, the group managed by level structure is displayed as "1-level/2-level/3-level".
When display in ranking is selected, the sequence column at right is ranked in the sequence of displayed number of times from more to less.
The total value is displayed in the last line.
When multiple aggregation units are selected, the subtotal line will be displayed. However, during display in ranking, the subtotal line will not be displayed.
The aggregation value of each aggregation unit can be displayed in the Number column. After clicking the aggregation value, details can be displayed.
When the value of Number is relatively large, the error "[ERR-DTLAC199] Error occurred during processing" will occur when displaying the detailed result. In this case, execute the following countermeasures to display the detailed result after specifying a smaller value for Number.
- Reduce Aggregation Period
- Increase Aggregation Unit (since each item of Group, Terminal and User is AND condition, conditions needs to be filtered)
- Filter by Keyword
- Aggregate by time
After the link of Number is clicked, the details of the aggregation value will be displayed.
If the log has no detailed item or has blank detailed items, it will be displayed with "-".
During "Show Details" display, when there is a large number of cases, the result will be displayed in unit of 1000 cases.
The average size of data displayed on each page is 0.5MB. When a large amount of detailed results is displayed (for example, when 100,000 cases of "Show Details" results are displayed) a disk capacity of about 50MB is required. When the disk capacity is not enough, to reduce the aggregation value as much as possible, refine the aggregation unit and reduce the aggregation period before detailed displayed.
In the process of aggregation or cancellation of aggregation, do not execute the following operations. If the execution is started, the uncompleted processing will be remained and processing may not be able to be performed in a certain time.
Move to windows displayed in Global Navigation and function menu.
Logout operation
Window operation based on browser functions (Close, Back, Update, etc)

Displayed content varies with aggregation objectives. Refer to "Appendix A List of Aggregation Objectives" for details.
To return to the aggregation result, click the Aggregation Result button.
Export Aggregation Result or Detailed Result in CSV Format
In aggregation by objectives, the aggregation result or detailed result can be exported to files in CSV format.
The aggregation result can be used by taking the downloaded CSV file as Microsoft Excel data.
The character encoding for the CSV file must match the setting on the import source Management Server of the Log Analyzer Server being referenced (encoding setting for the I/O files of the Server Settings Tool). However, if the encoding setting is changed on the Management Server, the change will not be reflected to the CSV file until the import to the Log Analyzer Server is complete.
The procedure is as follows:
Click the CSV Export button displayed at the bottom of the table of the aggregation result or detailed result.
In the environment with Microsoft Excel installed, the File Download window is displayed.
Click Open or Save.
The name of file for saving the aggregation result is "report.csv".
The name of file for saving the detailed result is "detail.csv".
Any file name can be renamed.