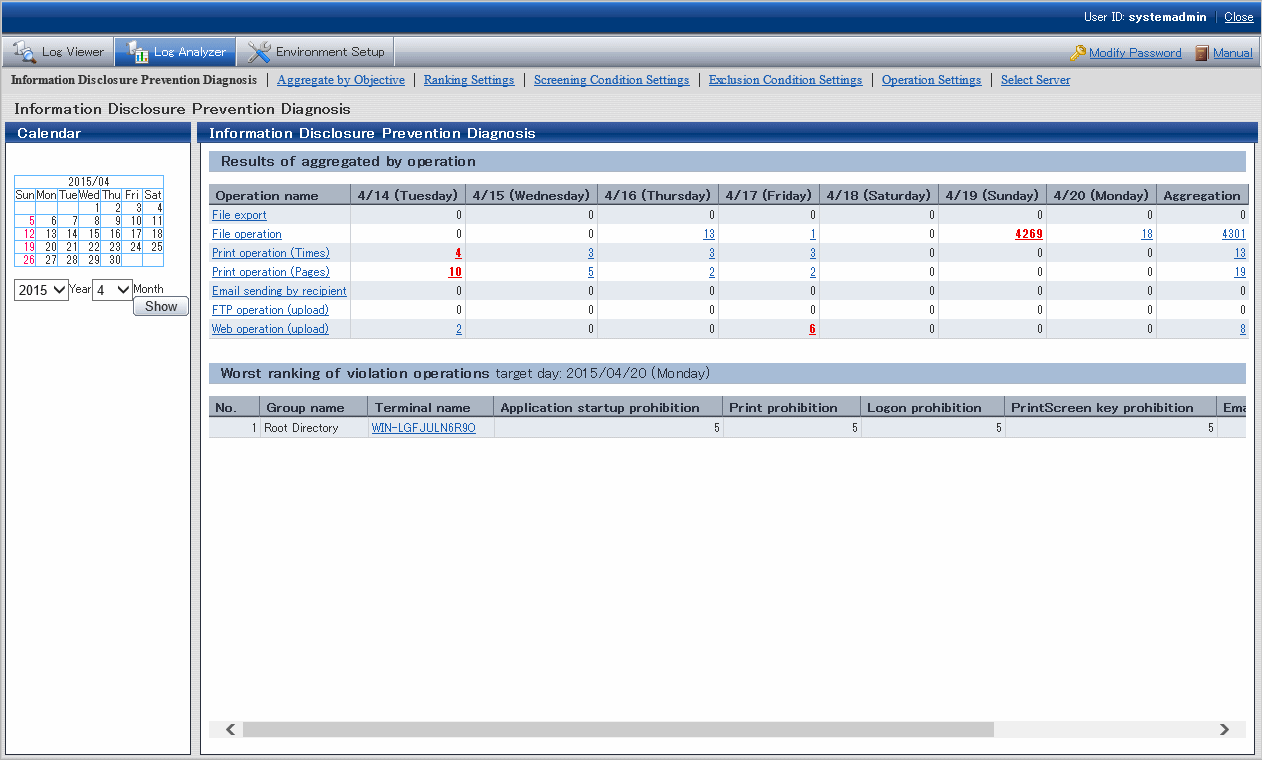
Diagnosis of information disclosure risk is performed in the Information Disclosure Prevention Diagnosis window.

Note
The number of logs displayed in the Information Disclosure Prevention Diagnosis window may be inconsistent with the number of logs in the result of aggregation by objectives
The number of logs displayed in the Information Disclosure Prevention Diagnosis window is the result of aggregation according to the filtering condition and exclusion condition during the transfer of logs from the Management Server to the Log Analyzer Server.
Therefore, the filtering condition/exclusion condition modified after aggregation and the logs transferred in after aggregation (*) cannot be reflected.
On the other hand, aggregation by objectives is a real-time aggregation, which means aggregation of the logs that have already been transferred according to the latest filtering condition/exclusion condition will occur.
Therefore, the number of logs displayed in the Information Disclosure Prevention Diagnosis window may be inconsistent with the number of logs in the result of aggregation by objectives.
If it is expected to display the result of aggregation that includes the logs transferred after aggregating according to the filtering condition/exclusion condition modified after aggregation (when it is expected to aggregate again according to the latest data and conditions), re-aggregation is required.
For re-aggregation, refer to "DTTOOLEX.EXE (Move or Delete Data from Log Analyzer Server)" of Reference Manual.
Due to reasons such as a lack of connection between the client (CT) and network, sending of operation logs to the Management Server may be delayed. Therefore, the reflection of logs transferred to the Log Analyzer Server may be delayed.
In Result of aggregation by Operation of the Information Disclosure Prevention Diagnosis window, the result of aggregation during log transfer from Management Server to Log Analyzer Server is used to display the number of operation logs collected at each terminal in the last week.
Aggregation is executed according to the filtering condition (keywords) and exclusion condition (file export, file operation, printing operation, E-mail sending according to recipient address) that are set in "2.7.2.2 Set Conditions for Aggregation/Report Output".
The following operation logs will be aggregated:
File export operation log
According to this log, the number of operations for exporting files to removable media using the file export utility is aggregated.
File operation log
According to this log, the number of operations for creating, updating, moving and copying files on the media identified as removable drive and DVD/CD is aggregated.
Though file operation also includes deleting, renaming and viewing, since these operations have very low risk of information disclosure, they will not be aggregated.
Printing operation log
Aggregate the times of printing operation and the total number of printed pages.
Even if the printed file contains many pages, the count of printing operation is still 1.
When the printed file contains many pages, the number of printed pages is counted (the total number of pages of the file is counted).
E-mail sending log
The number of operations for sending E-mail to the outside of company is aggregated (the domain of company internal E-mail address needs to be registered as the filtering condition).
In addition, the emails sent to groups will be counted as multiple operations.
FTP operation log (upload)
The number of file uploads to the FTP server is aggregated.
Web operation log (upload)
The number of file uploads to the web site is aggregated.
When there are a large number of logs, the possibility of information disclosure can be considered. In each operation, the cell of date with most number of logs is shown in red.
In addition, the number of each operation can be shown in graph, or the details of the number can be displayed in ranking.
If the setting of "2.7.2.2 Set Conditions for Aggregation/Report Output" is not performed, the number will increase rapidly with the growth of business and scale. In this case, not only the processing time and data amount for displaying will be increased, but it will also be difficult to identify dangerous operations. Make sure to apply this setting.
Display the Number in Graph
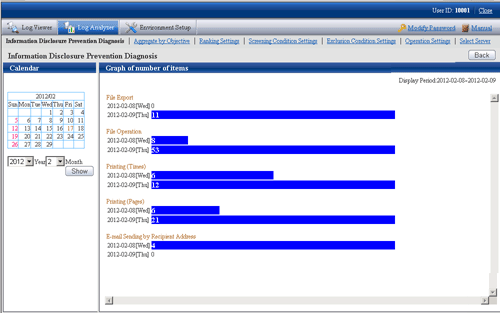
After clicking the various operation names displayed in the result of aggregation by objectives, the variation of number within one week will be displayed in graph.
The scale of graph varies with operations (The length displayed in a graph as the maximum number of each kind of operation in a week is in 100% status).
The procedure is as follows:
Click the operation displayed in graph in Operation name of the result of aggregation by operation.
The graph is displayed.
Display Details of Number in Ranking
After clicking the date column and total column of the result of aggregation by operation, the details of number will be displayed in ranking.
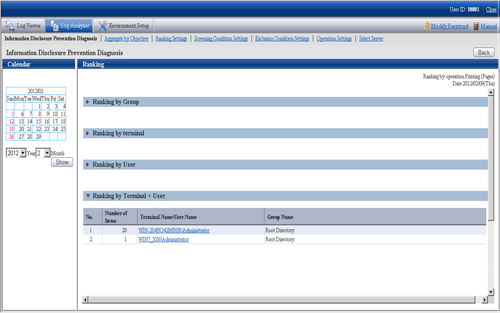
The ranking is shown as follows:
Ranking by Group
The number is aggregated in the unit of group and displayed in order from more to less.
The displayed group name can contain up to 1024 halfwidth characters (512 fullwidth characters).
In the CT group tree of Management Console, the Group Name of client (CT) exists under the root directly is displayed as "Root directory".
The group managed by level structure is displayed as "1-Level/2-Level/3-Level".
Ranking by terminal (*1)
The number is aggregated in the unit of terminal and displayed in order from more to less. The group name to which the terminal belongs will also be displayed.
Ranking by User
The number is aggregated in the unit of user name and displayed in order from more to less. Even if the terminals are different, total aggregation can still be performed when user names are the same.
Ranking by Terminal + User (*1)
The number is aggregated in the unit of combination of terminal name and user name and displayed in order from more to less. The group name to which the terminal belongs will also be displayed.
In the case of the same number, it is displayed in the sequence set in ranking settings (the display order of same ranking is random), but a maximum of 99 lines can be displayed.
*1: "Terminal name" and "Terminal + User Name" of ranking items are displayed in the following forms:
When the Name and Computer Name displayed in the CT list of Management Console are the same
The conditions to make Name and Computer Name the same are as follows:
Since Name is not updated after CT installation, the Computer Name will be displayed as the initial value.
In the Management Console, the Name is updated to the name that is same as Computer Name
At this time, in ranking by terminal, it will be displayed in form of "Computer Name".
[Example] PC001
In ranking by terminal, it will be displayed in form of "Computer Name + User Name [Group Name]".
[Example] PC001+Administrator
When the Name and Computer Name displayed in the CT list of the Management Console are different
The conditions to make Name and Computer Name different are as follows:
In the Management Console, the Name is updated to the name that is different from Computer Name
At this time, in ranking by terminal, it will be displayed in form of "Computer Name (Name)".
[Example] BLONO (Fujitsu Taro)
In ranking by terminal + user name, it will be displayed in form of "Computer Name (Name) + user name".
[Example] BLONO (Fujitsu Taro) + Administrator
The ranking of operations on the selected date is displayed.

The ranking of target operations in the aggregation period is displayed.
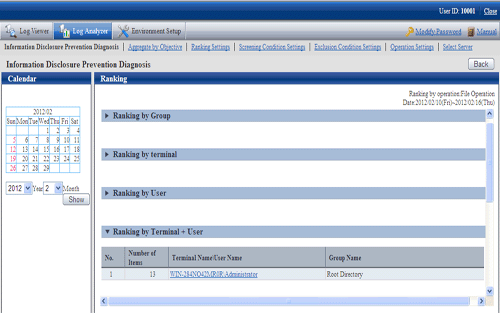
In the displayed ranking result, after the link of group name, terminal name and terminal + user name is clicked, the window will switch to Log Viewer (when the "Operate in Compatible with Desktop Log Analyzer" check box is selected, it will switch to the window of aggregating by objectives). In Log Viewer, the result of log search executed according to the conditions (Aggregation period, user name, terminal name, etc) during aggregation will be displayed in Log List. When viewing the number of E-mail sending by recipient address in Log Viewer, since the group E-mail that exists in the Log Analyzer will be counted by recipient address while the group E-mail is counted as 1 in Log Viewer, the number of logs may be inconsistent. When Operate in Compatible with Desktop Log Analyzer is selected in Operation Settings, after the link of clicking the link of group name, terminal name and terminal + user name is clicked, the window will switch to aggregate by objectives.
However, when the result of aggregation by operation contains more than 100,000 cases, it is unable to switch to the Log Viewer window (the Log list cannot be viewed).
In addition, the groups under the names of Root directory, Local and Deleted CT in ranking by group cannot be switched to the Log Viewer window as well.
In the ranking of violations, the ranking based on the total number of violations is displayed.
The number of violations is aggregated according to the following violation logs and the ranking is displayed according to the total number of each kind of operation.
Application startup prohibition log
Printing prohibition log
Logon prohibition log
PrintScreen key prohibition log
E-mail attachment prohibition log
In the displayed result of ranking, after the link of terminal name is clicked, the window will switch to Log Viewer. In Log Viewer, the result of log search executed according to the conditions (Aggregation period, terminal name, etc) during aggregation will be displayed in Log List.
Specify a date in the calendar and the aggregated number of each operation in the last week will be displayed based on the specified date.
Before execution, confirm whether the logs within the period for aggregation exist on the Log Analyzer Server. The number of logs that can be transferred is the logs recorded in the past year.
Specify a date within the range of Jan. 1, 2005 to present and the aggregation result can be viewed.
Click the correspondent date in the calendar.
Or, select year and month in the combo-box under the calendar and click the Show button.
