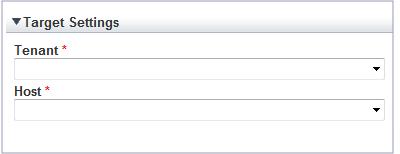
When a report is specified, the following items are displayed: The items displayed are report specific.
The following is an example window when Tenant and Host are specified:

The items that are specified are explained below for the different types.
Tenant specified
Item | Description |
|---|---|
Tenant | Select the tenant to be analyzed from the tenant menu. |
Tenant and Host specified
Item | Description |
|---|---|
Tenant | Select the tenant to be analyzed from the tenant menu. |
Host | Select the host to be analyzed from the host menu. |
VMware virtual machine relocation
Item | Description | ||
|---|---|---|---|
Tenant | Select the tenant to be used for VMware virtual machine simulation from the tenant menu. | ||
Relocation candidate | Relocation candidate | To add a candidate for reallocation, click [Add], then add using the [Add Relocation candidate] dialog that is displayed. Also, while it is possible to configure without using this product and select a virtual machine that is not being managed as an L-Server, perform one of the following if executing a reallocation:
| |
Add Relocation candidate | Host | Select the source host from the host menu. | |
Virtual machine | Select the virtual machine that is the candidate for reallocation. | ||
Aggregation target's information | Direct input of installed resource | If the consolidation destination host has already been registered in the tenant, select [Aggregate to a host in operation]. | |
Host | If [Aggregate to a host in operation] was selected, select the consolidation destination host from the menu. | ||
CPU | If [Direct input of installed resource] was selected, specify the consolidation destination server CPU clock number (GHz), number of cores in the CPU, and loaded memory capacity (GB) as numbers.
The specified number of CPUs and amount of memory are shown as black lines in the displayed graph. | ||
Note
Virtual hosts that have been stopped for more than 5 hours do not display virtual machine candidates for reallocation.
The following explains specifications relating to the number of display items, data intervals, and file output:
The items to be set differ depending upon the report type.
Item | Description |
|---|---|
Threshold | Specify the CPU and memory usage rates that will be tolerated on the consolidation destination server (optional). If this is specified, it is shown as a red line in the graph. |
Analysis mode | Specify the analysis method.
|
Number of Items Displayed | Select the number of data items to use for analysis. The number of data items can be selected as follows:
|
Operating time | Specify the time period to output the results of the analysis. |
Analysis data | Select the data interval to use for analysis. The following data intervals can be selected:
|
Output to File | The content of the results window is output as an Excel file. If the [Creates an Excel(R) file] check box is selected, the [Save in Excel(R) format] button becomes active at the bottom of the results window. Click this button and the displayed content can be downloaded in Excel format. Disable clipboard redirection if operation is to be performed using a remote desktop connection. If downloading files from the [Save in Excel(R) format] button, the "xlsx" or "xlsm" extension files can be downloaded. Note that you must enable the macro if the "xlsm" extension file is opened. |
Detail Settings
As, depending on the report type, the [Detail Settings] area may be displayed, the items to be set may differ.
The [Detail Settings] area is shown closed when a report is selected. Click the title bar of the [Detail Settings] to edit advanced settings.
Item | Description | |
|---|---|---|
Aggregation method | Analyze by maximum value. | The maximum values in the data interval are displayed. |
Analyze by mean value. | The average values in the data interval are displayed. | |
Output object | Analyze according to the disk reading and writing. | Select to display a distribution graph and table showing reads and writes. |
Analyze according to the network sending and receiving. | Select to display a distribution graph and table showing sends and receives. | |
Threshold (Arbitrariness) | Specify the pool usage rates that will be tolerated on the consolidation destination server (optional). If this is specified, it is shown as a red line in the graph. | |