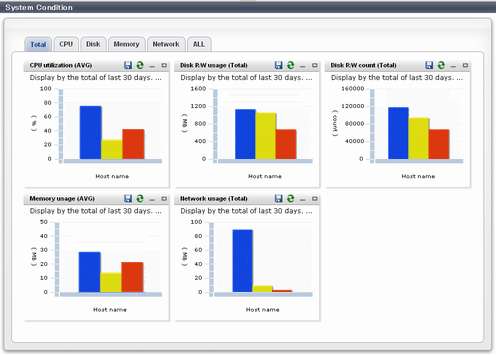
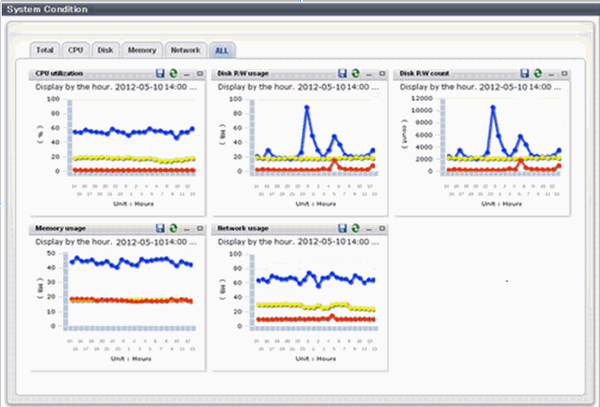
The system conditions of the L-Platforms selected in the system conditions window CI list is displayed as a graph at [System Conditions] in the lower part of the window. Up to five L-Servers can be displayed at once in the graphs. If more than five L-Servers are selected, the first five are displayed.
The system conditions contents can be switched by clicking the [System Conditions] tabs.
The table below shows the contents under the [System Conditions] tabs.
Tab name | Display content (*1) | Graph type | Display interval | Display interval switching (*2) |
|---|---|---|---|---|
Total | Totals for each status | Vertical bar graph | 30 minutes, starting from the current time | Not possible |
CPU | CPU utilization | Horizontal polyline graph | One hour/day/month/year from the current time | Possible |
Disk | Disk R/W usage (*3) | Horizontal polyline graph | One hour/day/month/year from the current time | Possible |
Disk R/W count (*4) | Horizontal polyline graph | One hour/day/month/year from the current time | Possible | |
Memory | Memory usage (*5) | Horizontal polyline graph | One hour/day/month/year from the current time | Possible |
Network | Network usage (*6) | Horizontal polyline graph | One hour/day/month/year from the current time | Possible |
All | Overview of all the above statuses | Horizontal polyline graph | One hour/day/month/year from the current time | Possible |
*1: Information is displayed using a different color for each L-Server.
*2: The display interval can be switched to a shorter interval by clicking the data plotting area of a horizontal polyline graph, or switched to a longer interval by clicking outside the data plotting area.
*3: Disk usage and network usage are not displayed if the server virtualization software is Hyper-V, RHEL5-Xen, Solaris Zones, OVM for x86 3.x, and OVM for SPARC.
*4: The disk R/W count is not displayed if the server virtualization software is Hyper-V, RHEL-KVM, Solaris Zones, and OVM for SPARC.
*5: The memory usage is not displayed if the server virtualization software is Hyper-V, and OVM for SPARC. However, this is displayed if the setting for the dynamic memory in Hyper-V is enabled.
*6: The network usage is not displayed if the server virtualization software is Hyper-V, Solaris Zones, and OVM for SPARC. It is also not displayed if the physical L-Server is Linux/Solaris.
Note
Information obtained from server virtualization software is displayed in the system conditions. Virtual Memory usage is not included.
When the server virtualization software of managed servers is VMware, RHEL5-Xen, RHEL-KVM, OVM for x86 3.x, or OVM for SPARC, the graph is not displayed when the manager is stopped because the data cannot be collected.
Also, when data cannot be collected temporarily due to restarting of the manager and so on, some of the data is not displayed.
The system conditions data is not reflected in the display until collection at the fixed intervals shown below is completed.
Check the display after the fixed intervals shown below.
Tab name | Display period (*) | Collection time required before displaying |
|---|---|---|
Total | 30 days | one whole day (from 0:00 to 23:59) |
CPU | one hour | ten whole minutes (from 0 minutes to 9 minutes) |
one day | one whole hour (from 0 minutes to 59 minutes) | |
one month/one year | one whole day (from 0:00 to 23:59) |
* Note: The display period in each tab except for Total tab can be selected from one hour, one day, one month, or one year.
System conditions data is not displayed if the power is off at the monitored L-Server.
If the CPU utilization status continues at 100% at the monitored L-Server, data collection timing may be delayed and an error of about one second may occur. This may cause CPU utilization (average value for a specified unit of time) to exceed 100%.
Take into account the possibility of data errors when using this display.
Example:
If a monitored L-Server has one CPU and is displayed in units of one hour, the value in the system conditions graphs and CSV file data may be displayed as 100.03% (60.02 minutes (near equal 3601 seconds)/60 minutes) even though the upper limit for CPU utilization is 100%.
When [Tenant (History)] is selected on the [Tree Display] tab, the operation status of the canceled L-Platform or L-Server is not displayed.
Display examples for the [Total] tab and the [All] tab are shown below.
[Total] tab

[All] tab

At each tab, the following icons displayed in the title bar can be used:
Icon | Tool tip | Explanation |
|---|---|---|
| Update | Updates the displayed contents |
| Download CSV file | Downloads the graph data in CSV format |
| Minimize | Minimizes the specified window |
| Maximize | Maximizes the specified window |
| Restore | Restores the maximized window |
The table below shows the CSV file items if data is downloaded from each graph.
Note that the CSV file encoding is Shift-JIS.
Graph type | Column name | Explanation | Unit | Description |
|---|---|---|---|---|
CPU utilization | sdattim | Collection start time (*) | yyyy-mm-dd HH:mm:ss | |
resrcid | Resource ID |
| ||
recid | Record ID | Output any of the following
| ||
consintl | Interval time | second |
| |
coverage | Data coverage | (0 to 1) | ||
cpupcent | CPU utilization | % | Output for physical servers | |
vmgcused | CPU utilization | % | Output only for VMware | |
physres | Physical CPU information or virtual CPU information | Output only for VMware | ||
ptrtim | CPU utilization | % | Output only for Hyper-V | |
xenpcused | CPU utilization | % | Output for RHEL5-Xen/OVM for x86 3.x CPU utilization (total utilization of virtual CPUs set in the domain) | |
xencpun | Number of virtual CPUs in the domain | number | Output for RHEL5-Xen/OVM for x86 3.x | |
Nickname | VM name | |||
kvmcpupcent | CPU utilization | % | Output only for RHEL-KVM | |
kvmcpus | Number of virtual CPUs in the domain | Output only for RHEL-KVM | ||
zonecpucappct | CPU utilization | % | Output for Solaris Zones | |
ovmcpupcent | CPU utilization | % | Output for OVM for SPARC | |
Disk R/W usage | sdattim | Collection start time (*) | yyyy-mm-dd HH:mm:ss | |
resrcid | Resource ID |
| ||
recid | Record ID | Output any of the following
| ||
consintl | Interval time | second |
| |
coverage | Data coverage | (0 to 1) | ||
preadbyt | Disk read usage | bytes | Output only for Windows | |
pwritbyt | Disk write usage | bytes | Output only for Windows | |
iokreads | Disk read usage | Kbytes | Output only for Linux/Solaris | |
iokwrite | Disk write usage | Kbytes | Output only for Linux/Solaris | |
vmdmbread | Disk read usage | Mbytes | Output only for VMware | |
vmdmbwrt | Disk write usage | Mbytes | Output only for VMware | |
Nickname | VM name | Output for VMware/RHEL5-KVM/physical server | ||
kvmdiskblockrdby | Disk read usage | bytes | Output only for RHEL-KVM | |
kvmdiskblockwrby | Disk write usage | bytes | Output only for RHEL-KVM | |
Disk R/W count | sdattim | Collection start time (*) | yyyy-mm-dd HH:mm:ss | |
resrcid | Resource ID |
| ||
recid | Record ID | Output any of the following
| ||
consintl | Interval time | second |
| |
coverage | Data coverage | (0 to 1) | ||
preadsec | Disk read count | Output only for Windows | ||
pwritsec | Disk write count | Output only for Windows | ||
ioreads | Disk read count | Output only for Linux/Solaris | ||
iowrite | Disk write count | Output only for Linux/Solaris | ||
vmdreads | Disk read count | Output only for VMware | ||
vmdwrites | Disk write count | Output only for VMware | ||
vbdrd | Disk read count | Output for RHEL5-Xen/OVM for x86 3.x | ||
vbdwr | Disk write count | Output for RHEL5-Xen/OVM for x86 3.x | ||
Nickname | VM name | Output for VMware/RHEL5-Xen/OVM for x86 3.x /physical server | ||
Memory usage | sdattim | Collection start time (*) | yyyy-mm-dd HH:mm:ss | |
resrcid | Resource ID |
| ||
recid | Record ID | Output any of the following
| ||
consintl | Interval time |
| ||
coverage | Data coverage | (0 to 1) | ||
comtot | Memory usage | bytes | Output only for Windows | |
freememp | Memory usage | bytes | Output only for Linux | |
memuse | Memory usage | percent | Output only for Linux | |
Vmgmtm | Memory usage | Mbytes | Output only for VMware | |
ppmemdmvm | Memory usage | Mbytes | Output only for Hyper-V | |
xenavm | Memory usage | Mbytes | Output for RHEL5-Xen/OVM for x86 3.x | |
Nickname | VM name | |||
kvmmemused | Memory usage | Mbytes | Output only for RHEL-KVM | |
zonepmemused | Memory usage | Kbytes | Output for Solaris Zones | |
Network utilization | sdattim | Collection start time (*) | yyyy-mm-dd HH:mm:ss | |
resrcid | Resource ID | Output only for Windows | ||
recid | Record ID | Output any of the following
| ||
consintl | Interval time |
| ||
coverage | Data coverage | (0 to 1) | ||
ifbytin | Network usage (received) | bytes | Output only for Windows | |
ifbytot | Network usage (sent) | bytes | Output only for Windows | |
vmnpmvtr | Network usage (sent) | Mbits | Output only for VMware | |
vmnpmbrecv | Network usage (received) | Mbits | Output only for VMware | |
xenkbtx | Network usage (sent) | Kbytes | Output for RHEL5-Xen/OVM for x86 3.x | |
xenkbrx | Network usage (received) | Kbytes | Output for RHEL5-Xen/OVM for x86 3.x | |
Nickname | VM name | Output for VMware/RHEL5-Xen/RHEL-KVM/OVM for x86 3.x/and physical servers with Windows OS | ||
kvmnetrxby | Network usage (received) | bytes | Output only for RHEL-KVM | |
kvmnettxby | Network usage (sent) | bytes | Output only for RHEL-KVM |
* Note: When the information from the virtual L-server where the live migration was performed is output to CSV, the following phenomena may occur:
Information for a certain point of time is output twice
Information for a certain point of time is not output
If there is a large difference in the time and date in the VM host where the live migration was performed, the above phenomena will be more likely to occur.