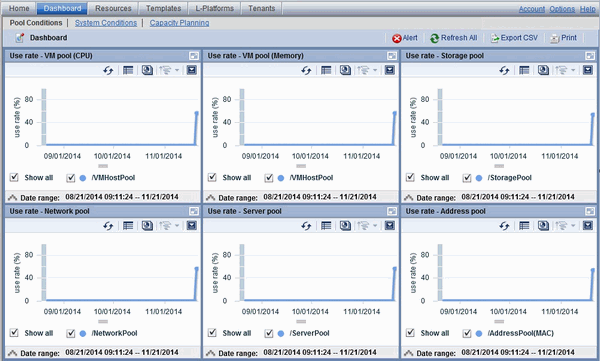
Perform the following steps to display the Pool Conditions:
From the ROR console, select the [Dashboard] tab, then select [Pool Conditions] in the displayed sub tab.
Charts are displayed for use rate of each resource pool.

Note
Dual-role administrator privileges
Global pool is displayed by default when logging in as the dual-role administrator.
To reference another pool, use the [Tenant ID] menu at the top right of the window.
The following table lists the six types of charts available.
Chart | Explanation |
|---|---|
VM pool (CPU) | Displays the VM pool (CPU) use rate of each pool as polyline graphs. Always displayed. |
VM pool (memory) | Displays the VM pool (memory) use rate of each pool as polyline graphs. Always displayed. |
Storage pool | Displays the storage pool use rate of each pool as polyline graphs. Always displayed. |
Network pool | Displays the network pool use rate of each pool as polyline graphs. Always displayed. |
Server pool | Displays the server pool use rate of each pool as polyline graphs. This is only displayed if physical servers are registered to the server pool. |
Address pool | Displays the address pool use rate of each pool as polyline graphs. This is only displayed if physical servers are registered to the server pool. Also, the information of the address set resources of the global IP address are not displayed. |
The table below shows the icons displayed in charts.
Icon | Explanation |
|---|---|
| Displays the relationship chart menu |
| Switches between the use rate chart and the relationship chart. |
| Updates the chart with the most recent information |
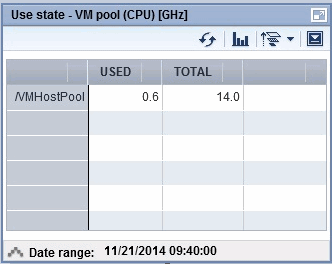
| Toggles between table and polyline graph displays |
| Displays a list of functions
|
| Enlarges the chart display |
Display detailed information in other charts.
If required, display detailed information in other charts.
Refer to "4.3 Chart Display" for details of the information displayed in other charts.
The table below shows how to display detailed information.
Item | Display method | Contents displayed |
|---|---|---|
Relationship chart | Click the relationship chart icon ( | Displays a relationship chart in which the focus is switched to a display of resource pool absolute values or similar. |
A window example is shown below.

Point
When returning to the use rate window from the relationship chart window, click on the ![]() icon to move the displayed slider to the top.
icon to move the displayed slider to the top.
Note
If the Pool Conditions window is left open in a Web browser, the connection to the server may time-out and an error may display in the window. If this occurs, close the Web browser, and then display the Pool Conditions window again.
If the administrator changes the setting of the Pool Conditions while the ROR console window is displayed, the following messages are displayed.
The graph cannot be displayed.
The table cannot be displayed.
Failed to display Analytics screen.
The Analytics Server is not started.
The connection to the Analytics Server failed.
Session is invalid.
Unexpected error has occurred.
If this occurs, refresh the window of the Web browser or close the Web browser and then display the Dashboard window again.
When the same message is displayed, try it again a few minute later.
When a linked service is stopped, just a border may be displayed, or the display may indicate that there is no data Check logs such as the operating system logs, and restart the Manager. Refer to "2.1 Starting and Stopping Managers" in the "Operation Guide CE" for information on stopping and starting the Manager.