This section describes the operation of displaying operation status and performing operation processing in the status window.
The operation processing in the status window can be performed in the window for viewing the PC corresponding to aggregation item. Refer to "3.2.11.4 View Corresponding PC according to Aggregation Item".
The status window will be displayed after logging in as system administrator and section administrator.
The procedure of viewing from the main menu is shown below.
Log in to the main menu.
The status window will be displayed.
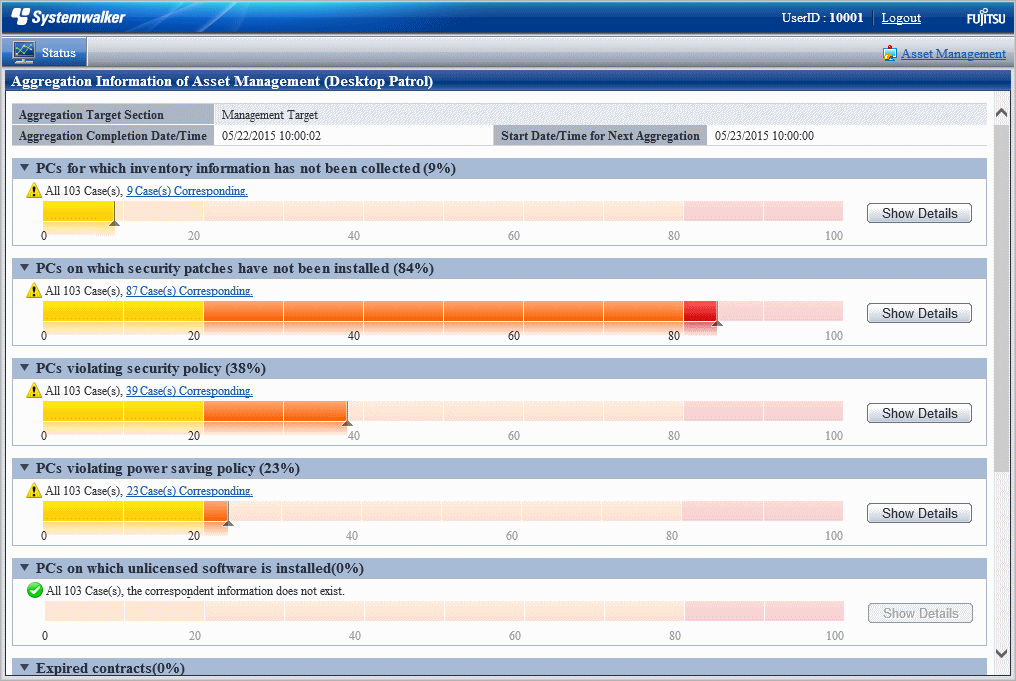
The range of status can be confirmed varies depending on operation authority.
Operation Authority | Confirmation Range |
|---|---|
System administrator | The status of the whole system of Systemwalker Desktop Patrol can be confirmed. Status relating to Without Configuration can also be confirmed. |
Section administrator | The status of the entire section to which the section administrator belongs can be confirmed. |
Displayed items
The displayed items are shown as follows.

Item | Content |
|---|---|
Status | It is a window in which the operation status can be confirmed at one view. |
User ID | The user ID that has logged in will be displayed. |
Assets Management | When viewing details relating to asset management or performing settings relating to the status window, click this link. |
![]()
Item | Content |
|---|---|
Aggregation Target Section | It shows the range of aggregation sections output to the status window. The range of department to be aggregated varies depending on the authority of login ID. System administrator: managed target (target at the whole section) Section administrator: Section to which it belongs (include lower level) |
Aggregation Completion Date/Time | It shows the time when aggregation has completed. This information can help determining the time point when the aggregation information is output to status window. When it is in aggregation, "(Aggregating)" will be displayed after the time. When the time is not displayed, it means aggregation has not been performed yet. |
Start Date/Time for Next Aggregation | It shows the time when next aggregation will be started. The timing when the information of status window is updated can be predicted through this information. |
The display format of each aggregation item is described by taking PCs for which inventory information has not been collected as an example.
When the Show Details button is not clicked

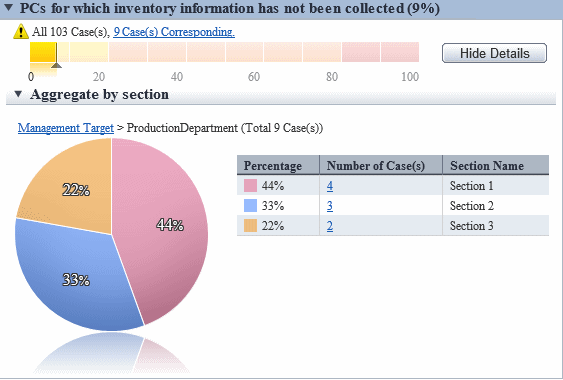
When the Show Details button is clicked
Item | Content |
|---|---|
| Percentage of PCs/devices/contracts that fall into each aggregation item in the aggregation target section. If the aggregation item is Devices detected as unregistered devices, then the number of devices is displayed instead of the percentage. The percentage is an integer value, rounded up to the first decimal point if the value is less than 50%, or truncated to the first decimal point otherwise. |
| It means the ratio is 0%. If the aggregation item is Devices detected as unregistered devices, then this means that no unregistered device has been detected. |
| It means the ratio is over 1%. If the aggregation item is Devices detected as unregistered devices, then this means more than one unregistered device has been detected. |
| Number of PCs/devices/contracts that fall into each aggregation item in the aggregation target section. If the aggregation item is Devices detected as unregistered devices, only the number of unregistered devices is displayed. Click the link of the corresponding number and only the list of PCs/devices/contracts that is corresponding to this aggregation item will be displayed. |
| Proportion of PCs/devices/contracts corresponding to each aggregation item against all PCs/devices/contracts of the section to be aggregated in bar graph. If the aggregation item is Devices detected as unregistered devices, this will not be displayed because it is not the percentage. When the proportion is less than 50%, the first decimal place will be rounded up. When it is over 50%, the first decimal place will be rounded down and only the integer part will be displayed. |
| To view the details of each aggregation item, click the Show Details button. This button cannot be clicked if no PC/device/contract that falls into the aggregation item exists. To close the details window, click the Hide Details button. |
Note
When logout from the status window at the time when the asset management window is displayed
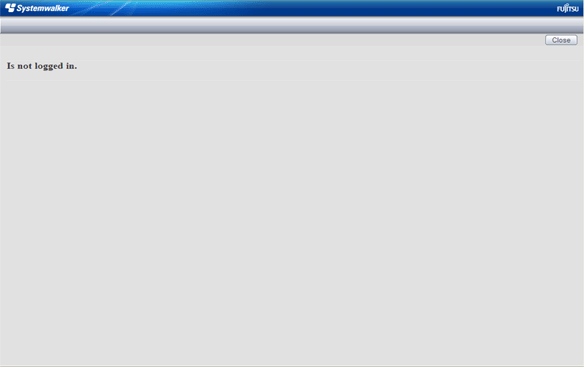
Since the asset management window has already been displayed in another window, even if logging out from the status window, the asset management window will still be displayed sometimes.
At this time, after operating the asset management window, it will become the window as follows which is unable to operate.
It describes the displayed content of the aggregation items displayed on the status window.
Note
If Connection Server set in the Server tab of the Environment Setup window on CT is changed from the host name specified when CS or DS is built, the server may be deemed non-target for auditing and may not be aggregated.
PCs for which inventory information has not been collected
View PCs for which inventory information has not been collected at the time when confirming how many PCs that does not collect and notify inventory information normally.
It can be viewed according to the following items.
The proportion of number of PCs for which inventory information has not been collected over the specified period against the number of all PCs (%)
Proportion and number of PC according to section (%)
The information of PCs for which inventory information has not been collected is aggregated according to the content set in "3.1.5 Perform Settings Related to Operation Status", and the aggregation result will be displayed in the status window.
Click the Show Details button and the information corresponding to this item will be displayed according to the section of PC.
For information on how to view displayed content, refer to "3.2.11.3 View Details According to Aggregation Items".
Click the link of the number of PCs, the list of corresponding PCs will be displayed. Process as needed.
PCs on which security patches have not been installed
View PCs on which security patches have not been installed at the time when confirming the PCs on which security patches have not been installed that is supported in software dictionary.
It can be viewed according to the following items.
The proportion of number of PCs on which security patches have not been installed against the number of all PCs (%)
Proportion and number of PC according to section (%)
The information of PCs on which security patches have not been installed is aggregated according to the content set in "3.1.5 Perform Settings Related to Operation Status", and the aggregation result will be displayed in the status window.
Click the Show Details button and the information corresponding to this item will be displayed according to the section of PC.
For information on how to view displayed content, refer to "3.2.11.3 View Details According to Aggregation Items".
Click the link of the number of PCs, the list of corresponding PCs will be displayed. Process as needed.
In PC Details > Unapplied Patch Information, the security patches to be installed will be displayed.
PCs violating security policy
View PCs violating security policy at the time when confirming the PC that violates the assigned security policy.
It can be viewed according to the following items.
Proportion of the number of PCs violating security policy against the number of all PCs (%)
Proportion and number of PC according to section (%)
Proportion and number of PC according to item (%)
The information of PCs violating security policy is aggregated according to the content set in "3.1.5 Perform Settings Related to Operation Status", and the aggregation result will be displayed in the status window.
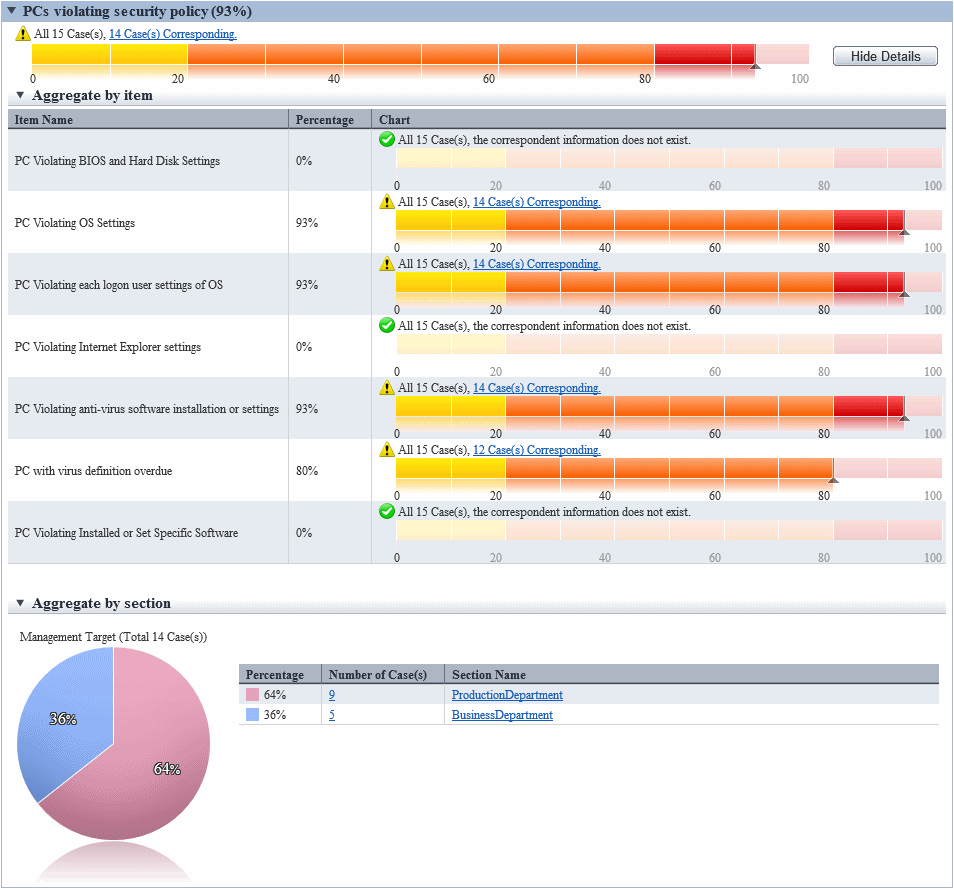
Click the Show Details button and the information corresponding to this item will be displayed according to the section of PC.
The example of display is shown below.
For information on how to view displayed content, refer to "3.2.11.3 View Details According to Aggregation Items".
Click the link of the number of PCs, the list of corresponding PCs will be displayed. Process as needed.
Information of each violation can be confirmed in PC Details > Security Information and the Unapplied Patch Information window. The description of each item is shown in the following table.
Item Category | Description | |
|---|---|---|
PCs violating security policy | It is the number of PCs that violates security policy. After selection, Aggregate by section and Aggregate by item are displayed in Show Details | |
Aggregate by section | It is the details of list item according to section. | |
Aggregate by item | PC Violating BIOS and Hard Disk Settings | For auditing content, refer to "Table 3.1 PC Violating BIOS and Hard Disk Settings". |
PC Violating OS Settings | For auditing content, refer to "Table 3.2 PC Violating OS Settings". | |
PC Violating each logon user settings of OS | For auditing content, refer to "Table 3.3 PC Violating each logon user settings of OS". | |
PC Violating Internet Explorer settings | For auditing content, refer to "Table 3.4 PC Violating Internet Explorer Settings" | |
PC Violating anti-virus software installation or settings | For auditing content, refer to "Table 3.5 PC Violating anti-virus software installation or settings". | |
PC with virus definition overdue | For auditing content, refer to "Table 3.6 PC with virus definition overdue". | |
PC Violating Installed or Set Specific Software | For auditing content, refer to "Table 3.7 PC Violating Installed or Set Specific Software". | |
* When multiple exceptions exist in one item, they will be counted as exceptions of one PC without counting the total.
The detail of judgment standard is as follows.
The PC with Judgment Result as * will be counted as PCs violating security policy.
Item | Auditing Settings | Setting Status | Judgment Result |
|---|---|---|---|
BIOS Startup | Do not audit | - | |
Audit | Unable to collect | ||
Not set | * | ||
Has been set | |||
Correct diagnosis result (*1) | |||
Audit laptop PC only | Unable to collect | ||
Not set | *(*2) | ||
Has been set | |||
Correct diagnosis result (*1) | |||
BIOS Settings | Do not audit | - | |
Audit | Unable to collect | ||
Not set | * | ||
Has been set | |||
Correct diagnosis result (*1) | |||
Audit laptop PC only | Unable to collect | ||
Not set | *(*2) | ||
Has been set | |||
Correct diagnosis result (*1) | |||
BIOS Settings Hard disk | Do not audit | - | |
Audit | Unable to collect | ||
Not set | *(*3) | ||
Has been set | |||
Correct diagnosis result (*1) | |||
Audit laptop PC only | Unable to collect | ||
Not set | *(*2)(*3) | ||
Has been set | |||
Correct diagnosis result (*1) |
*1: When the security diagnosis result is corrected to Auditing OK manually on CT
*2: Only the laptop PC will be judged
*3: PCs for which the hard disk password cannot be set will be judged as having the password Not set
Item | Auditing Settings | Setting Status | Judgment Result |
|---|---|---|---|
Supporting status of OS | Do not audit Do not display | - | |
Audit | Unable to collect | ||
Inappropriate (OS/SP is old) | * | ||
Appropriate | |||
Correct diagnosis result (*1) | |||
Automatic logon | Do not audit | - | |
Audit | Unable to collect | ||
Automatic logon | * | ||
Not automatic logon | |||
Welcome | Do not audit | - | |
Audit | Unable to collect | ||
Display | * | ||
Do not display | |||
Last user name | Do not audit | - | |
Audit | Unable to collect | ||
Display | * | ||
Do not display | |||
Security of Guest account | Do not audit | - | |
Audit | Unable to collect | ||
Password is not set | * | ||
Password and user name are matched | * | ||
Password has been set | |||
Not to be collected | |||
Account is OFF | |||
Account is disabled | |||
Existence of complex password | Do not audit | - | |
Audit | Unable to collect | ||
Disabled | * | ||
Enabled | |||
Settings of automatic update | Do not audit | - | |
Audit | Unable to collect | ||
Disabled | * | ||
Enabled (Details is unknown) | |||
Enabled (Manual installation) | |||
Enabled (Automatic) | |||
Enabled (Notify update only) | |||
User account control (UAC) | Do not audit | - | |
Audit | Unable to collect | ||
Disabled | * | ||
Enabled | |||
Unsafe shared folder | Do not audit | - | |
Audit | Unable to collect | ||
OK when all of access authorizes are not possessed | No shared folder | ||
With shared folder | * | ||
OK when only reading is allowed | No shared folder that requires writing authority | ||
There is a shared folder that requires writing authority | * | ||
Enter password when restoring from standby | Do not audit | - | |
Audit | Unable to collect | ||
Not set | * | ||
Has been set |
*1) When the security diagnosis result is corrected to Auditing OK manually on CT
Item | Auditing Settings | Setting Status | Judgment Result |
|---|---|---|---|
Screensaver | Do not audit | - | |
Audit | Unable to collect | ||
Do not start | *(*3) | ||
Start | |||
Screensaver password | Do not audit | - | |
Audit | Unable to collect | ||
Not set | *(*3) | ||
Has been set | |||
Password of logon user | Do not audit | - | |
Audit | Unable to collect | ||
Password not set | *(*3) | ||
Password and user name are matched | *(*3) | ||
Has been set | |||
Not to be collected |
*3) Even if one of the Windows logon user of the target PC violates the security policy, the security item will be considered as violation.
Item | Auditing Settings | Setting Status | Judgment Result |
|---|---|---|---|
Internet zone | Do not audit | - | |
Set "Medium-Low" or above as OK | Lower than "Medium-Low" | * | |
Higher than "Medium-Low" | |||
Set "Medium" or above as OK | Lower than "Medium" | * | |
Higher than "Medium" | |||
Set "Medium-High" or above as OK | Lower than "Medium-High" | * | |
Higher than "Medium-High" | |||
Set "High" or above as OK | Lower than "High" | * | |
Higher than "High" | |||
Set "Custom" as OK | "Custom" | ||
Set "Custom" as Failed | "Custom" | * |
Item | Auditing Settings | Setting Status | Judgment Result |
|---|---|---|---|
Installation status of anti-virus software | Do not audit | - | |
Audit | Unable to collect | ||
Not installed | * | ||
Has been installed | |||
Correct diagnosis result (*1) | |||
Real-time search of anti-virus software | Do not audit | - | |
Audit | Unable to collect | ||
Not set | * | ||
1 has been set | |||
2 or more have been set | |||
Correct diagnosis result (*1) | |||
Scheduled scan of anti-virus software | Do not audit | - | |
Audit | Unable to collect | ||
Setting is insufficient | * | ||
Has been set (The scanning execution date is old) | * | ||
Has been set | |||
Correct diagnosis result (*1) | |||
Target scanning range of anti-virus software | Do not audit | - | |
Audit | Unable to collect | ||
Not set | * | ||
Has been set | |||
Correct diagnosis result (*1) |
*1) When the security diagnosis result is corrected to Auditing OK manually on CT
Item | Auditing Settings | Setting Status | Judgment Result |
|---|---|---|---|
Virus pattern status of anti-virus software | Do not audit | - | |
1~10 Generation number that is set as OK (Audit) | Unable to collect | ||
Newer than the set policy | |||
Older than the set policy | * | ||
Older than 10 generations | * | ||
Anti-Virus software is not installed | * | ||
Correct diagnosis result (*1) |
*1) When the security diagnosis result is corrected to Auditing OK manually on CT
Item | Auditing Settings | Setting Status | Judgment Result |
|---|---|---|---|
Firewall | Do not audit | - | |
Audit | Unable to collect | ||
Not set | * | ||
1 has been set | |||
2 or more have been set | |||
Installation status of encryption software | Do not audit | - | |
Audit | Unable to collect | ||
Not installed | * | ||
Has been installed | |||
Correct diagnosis result (*1) | |||
Google Desktop "Data Search on Multiple Computers" | Do not audit | - | |
Audit | Unable to collect | ||
Not installed | |||
Enabled | * | ||
Disabled | |||
Detection status of prohibition software | Do not audit | - | |
Audit | Unable to collect | ||
Has prohibited software | * | ||
No prohibited software |
*1) When the security diagnosis result is corrected to Auditing OK manually on CT
PCs violating power saving policy
View PCs violating power saving policy at the time when confirming the PC that violates the assigned power saving policy.
It can be viewed according to the following items.
Proportion of the number of PCs violating power saving policy against the number of all PCs (%)
Proportion and number of PC according to section (%)
Proportion and number of PC according to item (%)
The information of PCs violating power saving policy is aggregated according to the content set in "3.1.5 Perform Settings Related to Operation Status", and the aggregation result will be displayed in the status window.
Click the Show Details button and the information corresponding to this item will be displayed according to the section of PC.
The example of display is shown below.
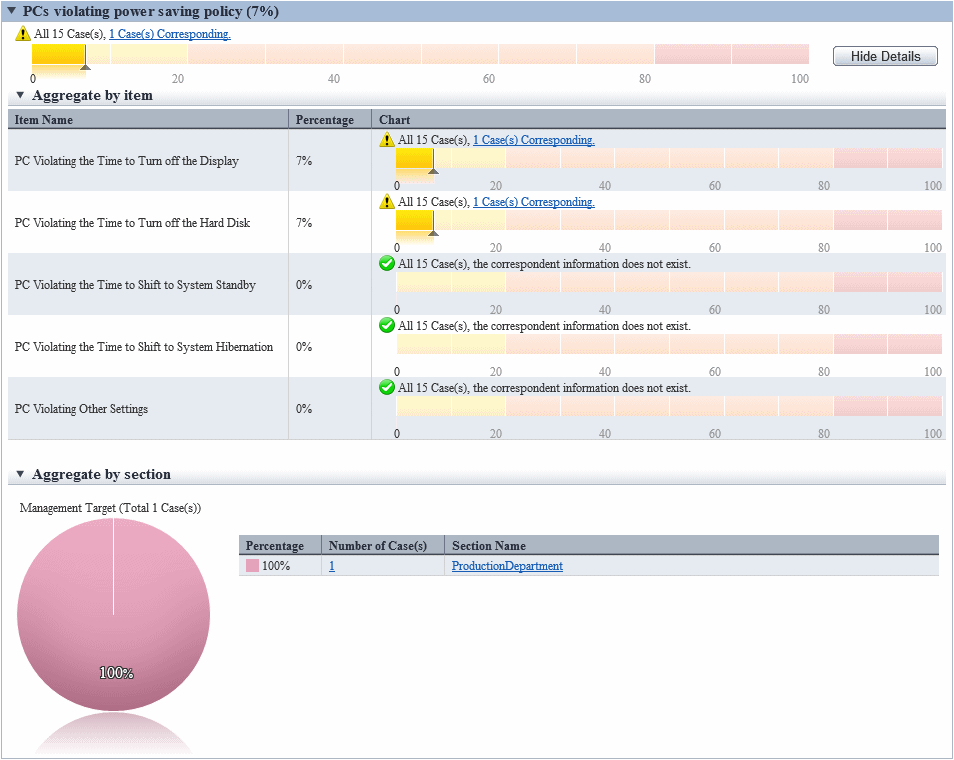
For information on how to view displayed content, refer to "3.2.11.3 View Details According to Aggregation Items".
Click the link of the number of PCs, the list of corresponding PCs will be displayed. Process as needed.
Information of each PC Violating Power Saving Policy can be confirmed in PC Details > Security Information and the Unapplied Patch Information window. The description of each item is shown in the following table.
Item | Description | |
|---|---|---|
PCs violating power saving policy | Number of PCs that violates power saving policy. After selected, Aggregate by section and Aggregate by item will be displayed in Show Details. | |
Aggregate by section | It is the details of list item according to section. | |
Aggregate by item | PC Violating the Time to Turn off the Display | For auditing content, refer to the item of Time to turn off the power of monitor of "Table 3.8 Auditing Item Content". |
PC Violating the Time to Turn off the Hard Disk | For auditing content, refer to the item of Time to turn off the power of hard disk of "Table 3.8 Auditing Item Content". | |
PC Violating the Time to Shift to System Standby | For auditing content, refer to the item of Time to shift to system standby of "Table 3.8 Auditing Item Content". | |
PC Violating the Time to Shift to System Hibernation | For auditing content, refer to the item of Time to shift to system sleep of "Table 3.8 Auditing Item Content". | |
PC Violating other Settings | For auditing content, refer to the item of Other settings of "Table 3.8 Auditing Item Content". | |
* When PC is laptop, violation will be judged from settings both at connection to power and use of battery.
* When multiple exceptions exist in one item, they will be counted as exceptions of one PC without counting the total.
* When the number of PC with exception is 0, this item will not be displayed.
The detail of judgment standard is as follows.
The PC with Judgment Result as * will be counted as PCs violating power saving policy.
Item | Auditing Settings | Setting Status | Judgment Result | |
|---|---|---|---|---|
Time to turn off the power of monitor | Do not audit | - | ||
None is OK | - | |||
OK within n | Unable to collect | |||
Within n | ||||
Larger than n | * | |||
Time to turn off the power of hard disk | Do not audit | - | ||
None is OK | - | |||
OK within n | Unable to collect | |||
Within n | ||||
Larger than n | * | |||
Time to shift to system standby | Do not audit | - | ||
None is OK | - | |||
OK within n | Unable to collect | |||
Within n | ||||
Larger than n | * | |||
Time to shift to system sleep | Do not audit | - | ||
None is OK | - | |||
OK within n | Unable to collect | |||
Within n | ||||
Larger than n | * | |||
Other settings | Operation of Hybrid Sleep | Do not audit | - | |
ON is OK | Unable to collect | |||
OFF | * | |||
ON | ||||
Operation of Processor | Do not audit | - | ||
Set emphasis on balance | Unable to collect | |||
The set value of Status of Smallest Processor is lower than 5% | ||||
The set value of Status of Smallest Processor is higher than 5% | * | |||
Set emphasis on power saving as OK | Unable to collect | |||
The set value of Status of Smallest Processor is 0% | ||||
The set value of Status of Smallest Processor is not 0% | * | |||
Settings of selective suspension of USB | Do not audit | - | ||
Enabled is OK | Unable to collect | |||
The set value of Settings of Selective Suspension of USB is Disabled (*2) | * | |||
The set value of Settings of Selective Suspension of USB is Enabled (*2) | ||||
Brightness settings of monitor | Do not audit | - | ||
OK when the brightness of dark ~ normal | Unable to collect | |||
Lower than 70% | ||||
Higher than 70% | * | |||
Dark setting is OK | Unable to collect | |||
Lower than 40% | ||||
Higher than 40% | * | |||
* In case of laptop PC, if violation exists in one of the settings of Connect to Power and Use Batter, it will be counted as PC with violation.
*1) It is for OS later than Windows Vista only. In OS prior to that, Unable to collect will be displayed.
*2) In Windows(R) 7 or later and Windows Server(R) 2008 R2 or later, the setting name will become Settings of Selective Suspension of USB.
PCs on which unlicensed software is installed
To check how many PCs in which the software is installed but license is not assigned exist, view PCs on which unlicensed software is installed.
The following items can be viewed:
Number of PCs in which the software is installed but license is not assigned, and its percentage in overall number of PCs (%)
Number of the appropriate PCs and percentage per section (%)
Clicking Details Display displays information about the PCs that fall into this aggregation item, grouped by section.
Clicking the number of PCs display the list of the corresponding PCs. Take the required actions, such as assigning license to the PCs.
Refer to "5.3.4.2 Processing at Confirmation of License Violation PC" for details on how to take actions.
Expired contracts
To check how many expired contracts exist, view Expired contracts.
The following items can be viewed:
Number of contracts that have expired, and its percentage in overall number of contracts (%)
Number of the appropriate contracts and percentage per section (%)
Clicking Details Display displays information about the contracts that fall into this aggregation item, grouped by section.
Clicking the number of contracts displays the list of corresponding contracts. Take the required actions, such as deleting contract information or extending contracts. Note that even if a contract is extended, it will still be an aggregation target as long as old contract information remains. If you do not want it to be included as an aggregation target, delete the old contract information.
Refer to "11.4.1 Confirm Contract Information" for details on deleting contract information.
Refer to "11.4.5 Extend Contract" for details on contract extension.
Contracts about to expire
To check how many contracts are about to expire, view Contracts about to expire.
The following items can be viewed:
Number of contracts for which the days until expiry is less than the days before the notice of contract expiry is sent, and its percentage in overall number of contracts (%)
Number of the appropriate contracts and percentage per section (%)
Note that "days before the notice of contract expiry is sent" is the value specified in Management Ledger Settings > Set Contract Expiration Notification > XX Days Ago, Notify Prior Notice of Contract Expiration (where "XX" ca be 30, 60, 90, or 180).
Clicking Details Display displays information about the contracts that fall into this aggregation item, grouped by section.
Clicking the number of contracts displays the list of corresponding contracts. Take the required actions, such as deleting contract information or extending contracts.
Refer to "11.4.1 Confirm Contract Information" for details on deleting contract information.
Refer to "11.4.5 Extend Contract" for details on contract extension.
Devices for which stocktaking is not yet complete
To check how many devices for which stocktaking is not yet complete exist, view Devices for which stocktaking is not yet complete.
The following items can be viewed, which are hidden by default. Display and use them if required during stocktaking.
Number of devices for which stocktaking is not yet complete, and its percentage in overall number of devices (%)
Number of the appropriate devices and percentage per section (%)
Clicking Details Display displays information about the devices that fall into this aggregation item, grouped by section.
Clicking the number of devices displays the list of corresponding devices. Take the required stocktaking actions to complete stocktaking.
Refer to "11.5 Stocktaking Support" for details on stocktaking tasks.
Devices detected as unregistered devices
To check the number of devices for which registration is not yet completed, view Devices detected as unregistered devices.
Note that "unregistered devices" are the devices that have not been registered in the asset ledger after the collection information for devices connected with the network and the asset ledger are compared.
The following items can be viewed:
Number of the appropriate devices per installation location
Clicking Details Display displays information about the devices that fall into this aggregation item, grouped by installation location.Clicking the number of devices displays the list of corresponding devices. Take the required actions.
Refer to "11.2.3.2 Display/Register Unregistered Device" for details on how to take actions.
This section describes the format of details displayed after clicking the Show Details button in the displayed aggregation item information.
Details "Aggregate by section"
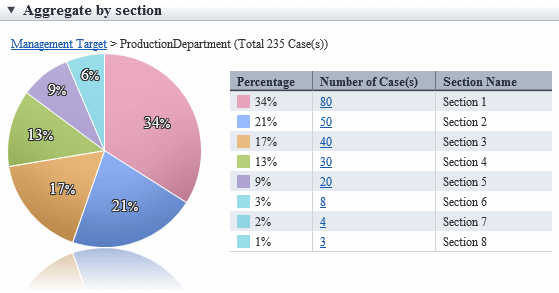
In this window, the PCs corresponding to each aggregation item is displayed according to section.
Item | Content |
|---|---|
| It shows the sections represented by the pie chart. Section name without a link: the section being displayed currently Section name with a link: Higher section Click the link and you can switch to the details related to the clicked section. (*1) The number of PCs corresponding to the aggregation item in the section is displayed in the () after section name. |
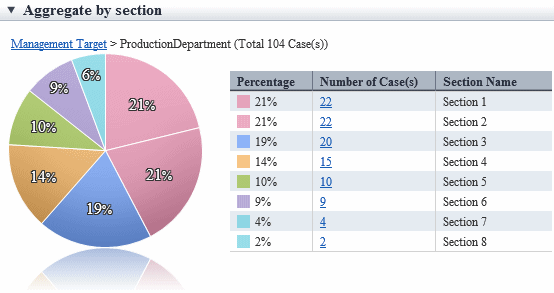
| It shows the PCs corresponding to the aggregation item according to section. Display in order from the section with most number of PCs. The meaning of each item is as follow. Proportion In the section displayed currently, it shows the proportion of PCs corresponding to the aggregation item occupied in the section. In the proportion, the first decimal place will be rounded off and only the integer part will be displayed. Therefore, the total value will not be 100% sometimes. Number of PCs It shows the number of PCs corresponding to the aggregation item. By clicking the link, the PC list of the clicked section can be displayed. Section Name Display the section name. By clicking the link, the details of the clicked section can be switched. (*1) If the section displayed in the pie chart is the section itself, it will be displayed as "-". In addition, it cannot be clicked in following cases. The bottom level department Without configuration It is the section displayed in pie chart |
| It shows the proportion occupied by each ranking in pie chart. (*2) In the proportion, the first decimal place will be rounded off and only the integer part will be displayed. Therefore, the total value will not be 100% sometimes. |
*1: When the structure of section contains multiple levels, it can be output according to level.
*2: The pie chart is displayed in different colors according to the number of PCs from more to less, and the number after the sixth will be displayed in the same color.
The example of pie chart is shown as follows.
Example of display when the number of PCs in all sections is different.
When the number of PCs of all sections is different from section 1 to section 8. For the section after the sixth, that is, from section 6 to section 8, the number will be shown in the same color.

Example of display when the same number of PCs exists up to the fifth section
Up to the fifth section, the number of PCs of section 1 and section 2 is the same, so section 1 and section 2 are displayed in same color.
Details "Aggregate by item"
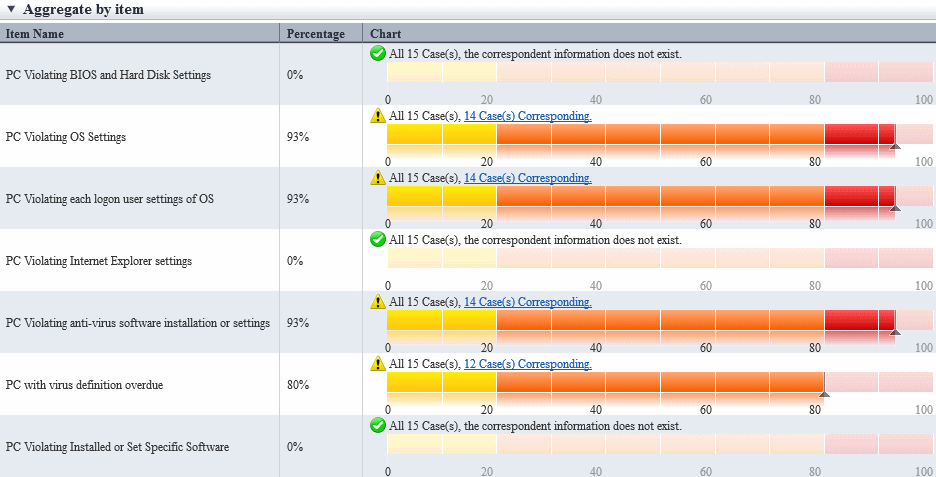
In this window, the PCs corresponding to each aggregation item is displayed according to item of policy. It takes PCs violating security policy as example for description.
Item | Content |
|---|---|
Item Name | Display the item name of security policy or power saving policy. By clicking the link, you can switch to the clicked item, which is the details of PC with violation. |
Percentage | It is the proportion of PC with violations against each item in the PC with assigned policy. |
| It means the ratio is 0%. |
| It means the ratio is over 1%. |
| It shows the number of PCs corresponding to each aggregation item against all PCs of the section to be aggregated. Click the link of this number, only the list of PCs corresponding the aggregation item will be displayed. |
Chart | The proportion will be displayed in graphs visually. |
Click the link of corresponding number in the status window and only the PC corresponding to the aggregation item can be viewed as PC list.
This window is displayed in a window other than the status window.
Note
Display the PC corresponding to aggregation item based on the inventory information of displayed time point.
Therefore, it may be different from the number of corresponding PC displayed in the status window.

The item of this window is displayed according to the item set in Inventory Information > Displayed Item Settings.
By clicking the Cancel button, you can return to the initial window of inventory information.
Operation action
Note
The information after operation action will be reflected at next time of inventory collection. The display of status window is not instant, which will be reflected at the next aggregation timing.
Check the corresponding PCs and perform operation action as needed.
The procedure when performing processing in this window is as follows.
Select the PC to be processed.
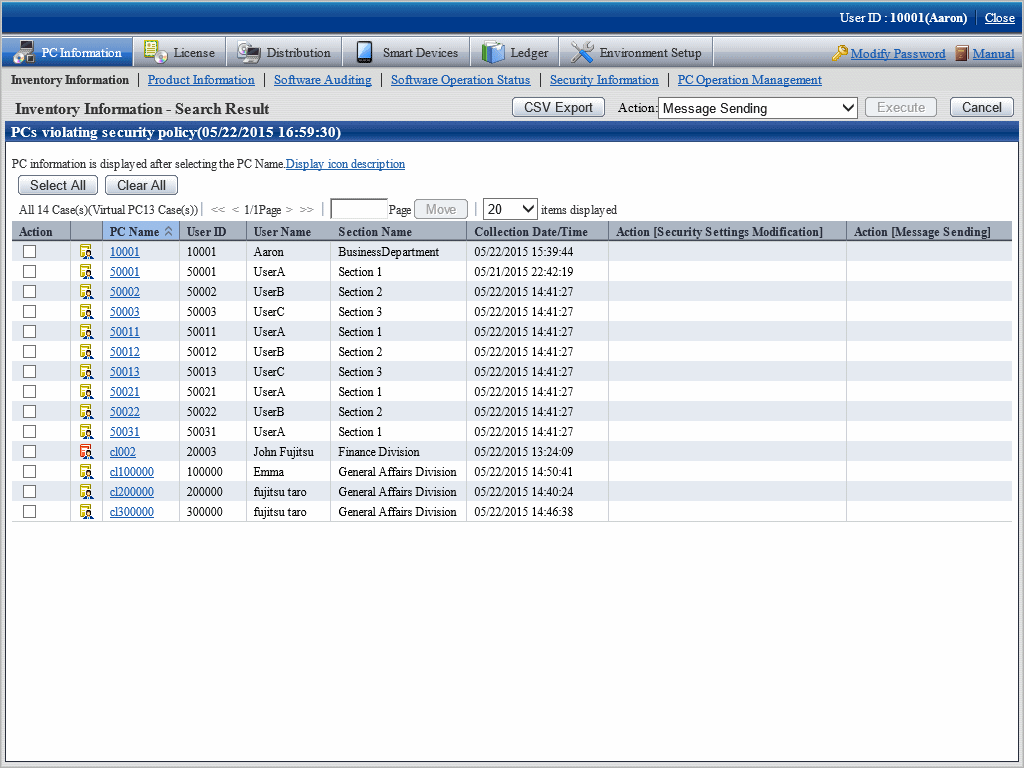
Select the content to be processed from the pull-down menu of Action, and click the Execute button.
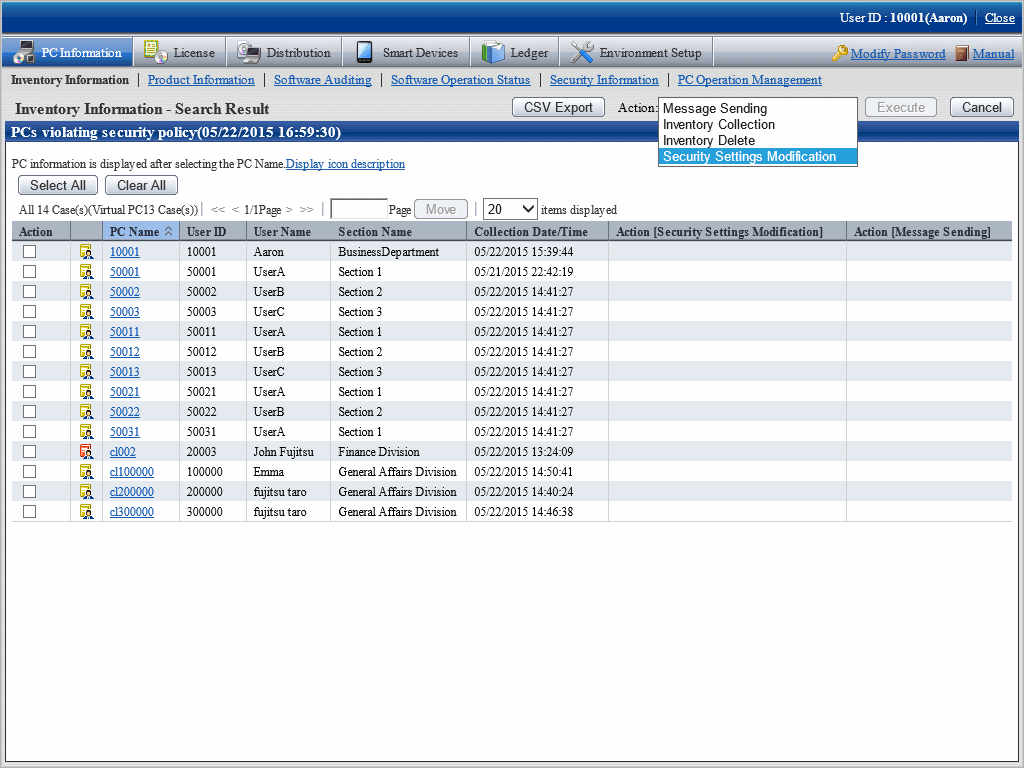
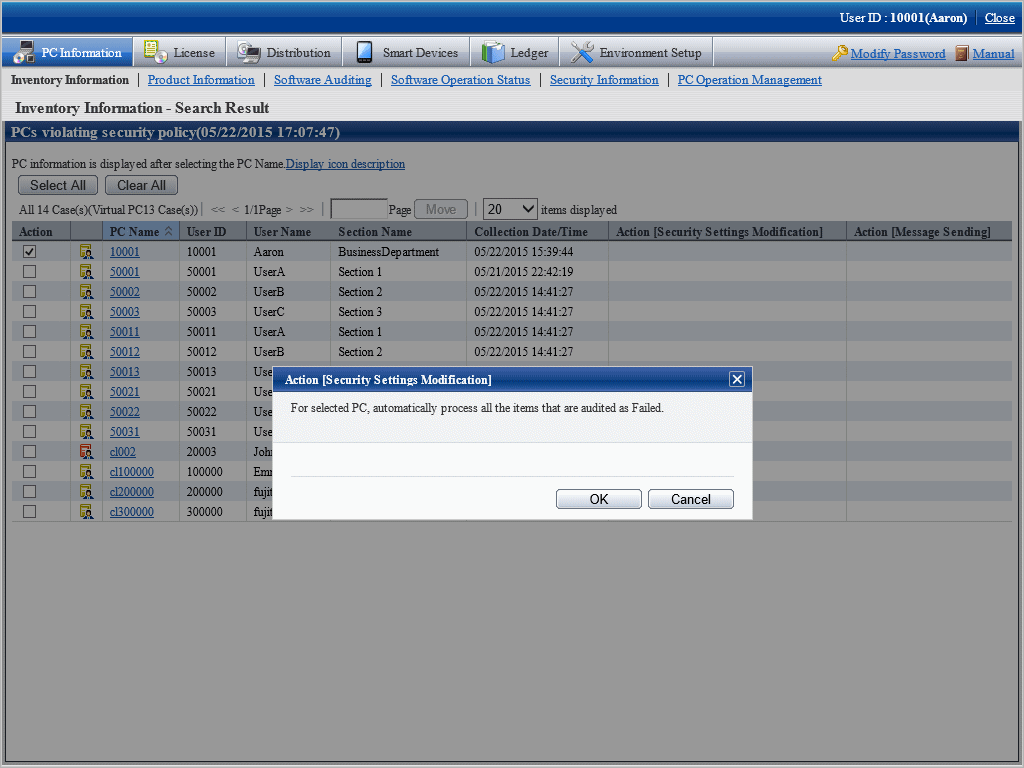
After the window for confirming the processing content is displayed, check the content and click the OK button.
The PC selected in Item No. 1 will be processed.
The following describes the content of selection item of Action.
The following processing content will be displayed.
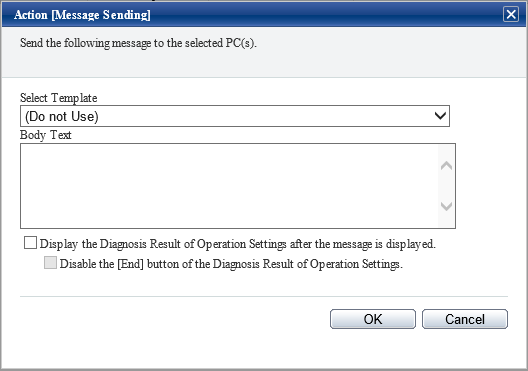
Select Template
Select the appropriate template from the templates prepared again. You can also create content again based on the content of selected template.
For the settings of template, refer to "Template using for Action Message Sending Confirmation Session".
Body text
Specify the message body when displaying a message using up to 1024 fullwidth or 2048 halfwidth characters.
Display the Diagnosis Result of Operation Settings after the message is displayed
After this check box is selected, Disable the [End] button of the Diagnosis Result of Operation Settings can be selected.
In addition, the Diagnosis button of the message window displayed in CT will be enabled. Click the Diagnose button, the diagnosis result window of operation settings will be displayed.
OK button
After it is clicked, message can be sent to the selected PC.
Note
Even if the body text is modified, it will not be reflected to the template. In addition, the body text of last time will be displayed at next time of processing.
After the message has been sent, the following message will be displayed on CT.
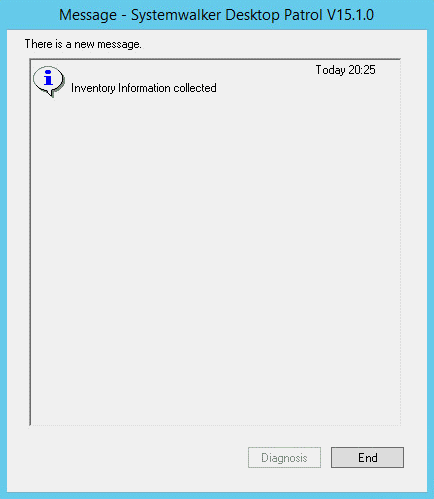
When the CT receives multiple messages at a time, it will be displayed as follows in CT.
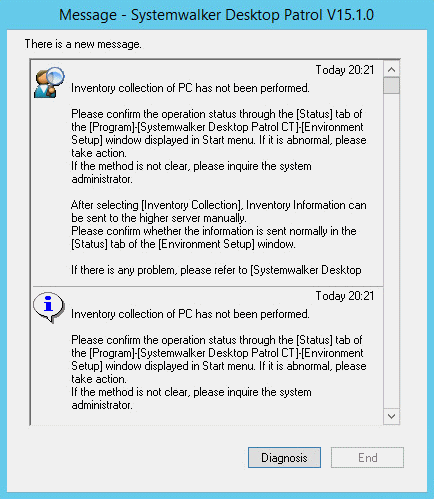
After the message of Display the Diagnosis Result of Operation Settings after the message is displayed is selected
The Diagnosis button will be enabled, and the Exit button will be disabled.
At this time, after the Diagnosis button is clicked, the diagnosis result window of operation settings will be displayed and the End button will be enabled.
The CT in which the message is displayed is the Ct with one of the following policy settings only.
- Select Policy Groups> Power Saving Policy > Display Diagnosis Result Window of Operation Settings.
- Select Policy Groups> Security Policy > Display Diagnosis Result Window of Operation Settings.
CT with these policy settings is the CT on which the diagnosis result window of operation settings can be started from selecting Start > All Programs > Systemwalker Desktop Patrol CT, or Apps > Systemwalker Desktop Patrol CT.
On the CT of the policy setting without any of the above item being selected, the diagnosis result window of operation settings cannot be displayed, and message cannot be displayed.
When Disable the [End] button of the Diagnosis Result of Operation Settings is selected
The exit button of the diagnosis result window of operation settings will be disabled and cannot be clicked.
After all processing has been done for the part that requires processing, the End button will be enabled and processing can be finished.
In addition, after selecting the range, the message can be copied. Even if information such as URL and contact address of administrator is contained in the message, it can be paste to another application through copy and paste.
The information received by CT in the past can be confirmed as follows in environment setup. For details, refer to "Message Sending and Message History" of Systemwalker Desktop Patrol Operation Guide: for Clients.
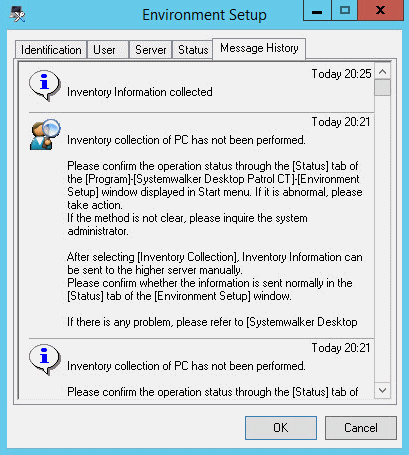
The number of items displayed is the latest 20 items.
The date displayed is the date when system administrator sends the processing instruction on the server.
The following processing content will be displayed.

Click the OK button to collect the inventory information of the selected PC.
Nothing will be displayed on CT and inventory information will be collected automatically.
The following processing content will be displayed.

Click the OK button to delete the inventory information of the selected PC.
The following processing content will be displayed.

Click the OK button, and security patches can be installed to the selected PC.
Nothing will be displayed on CT and security patches will be installed automatically.
Do not restart or perform inventory collection after patch installation. Inventory collection will run according to schedule.
The following processing content will be displayed.

Regardless of the aggregation item PCs violating security policy or Aggregate by item in display of details, all items that are audited as failed will be processed. The range that can be processed is limited to the items that allow auto-processing.
However, in Option > Settings of Status > Action [Security Settings Modification], when "Display the setting of "Set the items that do not allow auto-processing to be audited as OK is selected, the following window will be displayed.
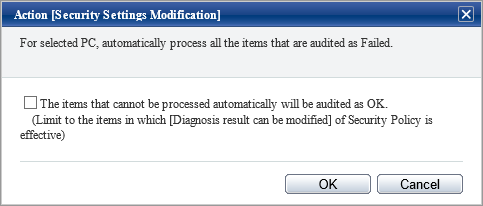
When processing the items that do not allow auto-processing, it is required to set Set the diagnosis result to be correctable in the policy settings again and then select Correct the diagnosis result to "Auditing OK" for the items that can be corrected in the above processing dialog.
For information on how to set Set the diagnosis result to be correctable, refer to the item descriptions of the Auditing Settings of System Security tab and the Auditing Settings of User Security tab of the Policy Groups - Security Policy window of "4.2.2.1 Set the Auditing Items of Security Settings".
The following processing will be performed on CT.
Nothing will be displayed on the window, the items of security settings that has been set as Audit in policy settings will be processed. If the Correct the diagnosis result to "Auditing OK" for the items that can be corrected check box is not selected, correct the items set in Set the diagnosis result to be correctable in the policy settings.
The following processing content will be displayed.

Regardless of the aggregation item PCs violating power saving policy or Aggregate by item in display of details, all items that are audited as failed will be processed.
The following processing will be performed on CT.
Nothing will be displayed on the window, the items of power saving settings that has been set as Audit in policy settings will be processed.
When Message Sending, Inventory Collection, Security Patch Installation, Security Settings Modification and Power Saving Settings Modification in the selection items of Processing are selected, information will flow to CT according to the following timing.
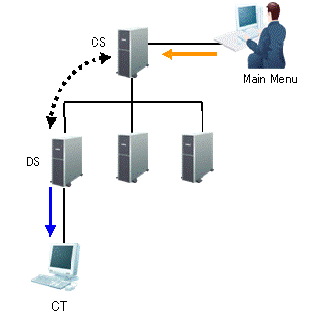
The information required in Processing and the timing when the information flows (initial value) is shown in the following table.
Line Type | Action | Opportunity of Action |
|---|---|---|
| Settings of processing | Any time |
| Synchronization of processing | Confirm in an interval of 5 minutes |
| Execution of processing | Confirm in an interval of 10 minutes |
Confirm the processing result
The processing result can be confirmed in the window for viewing PCs corresponding to aggregation item (PC list).
The processing result can be confirmed in processing unit.
In the displayed window, select the processing content to be displayed as a list in Displayed Item Settings.
For information on how to set Displayed Item Settings, refer to "How to modify the items displayed in the PC list".
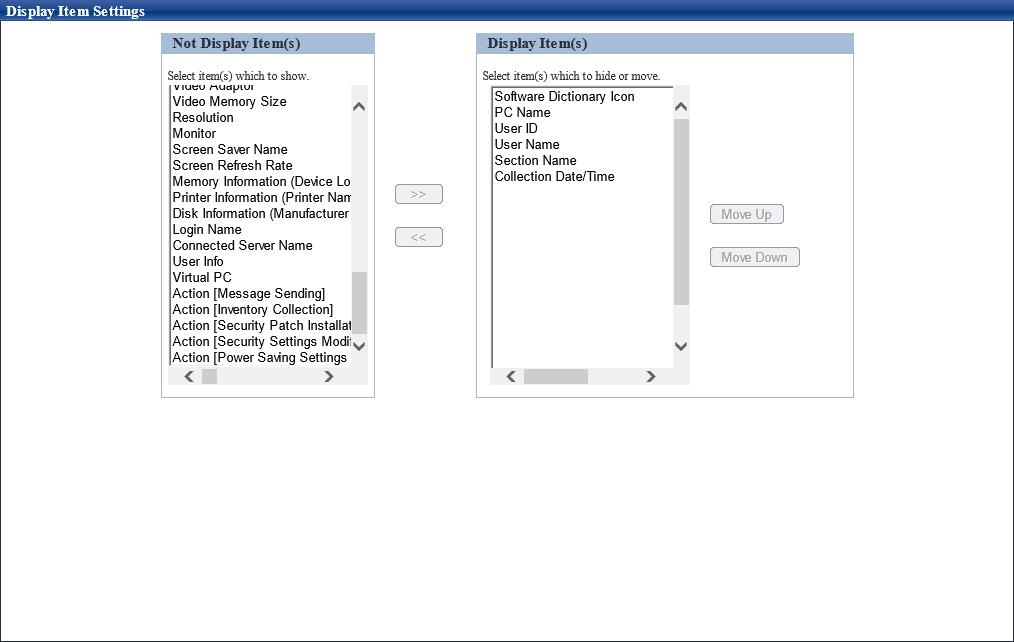
The following items are contained in processing. Modify the item to be displayed from hidden item to displayed item.
Action Message Sending
Action Inventory Collection
Action Security Patch Installation
Action Security Settings Modification
Action Power Saving Settings Modification
The time of processing last time and result of processing can be known through the items displayed in the window.
Therefore, even if processing has been done at last time in aggregation result, it is still easy to process the PC that has been detected again.
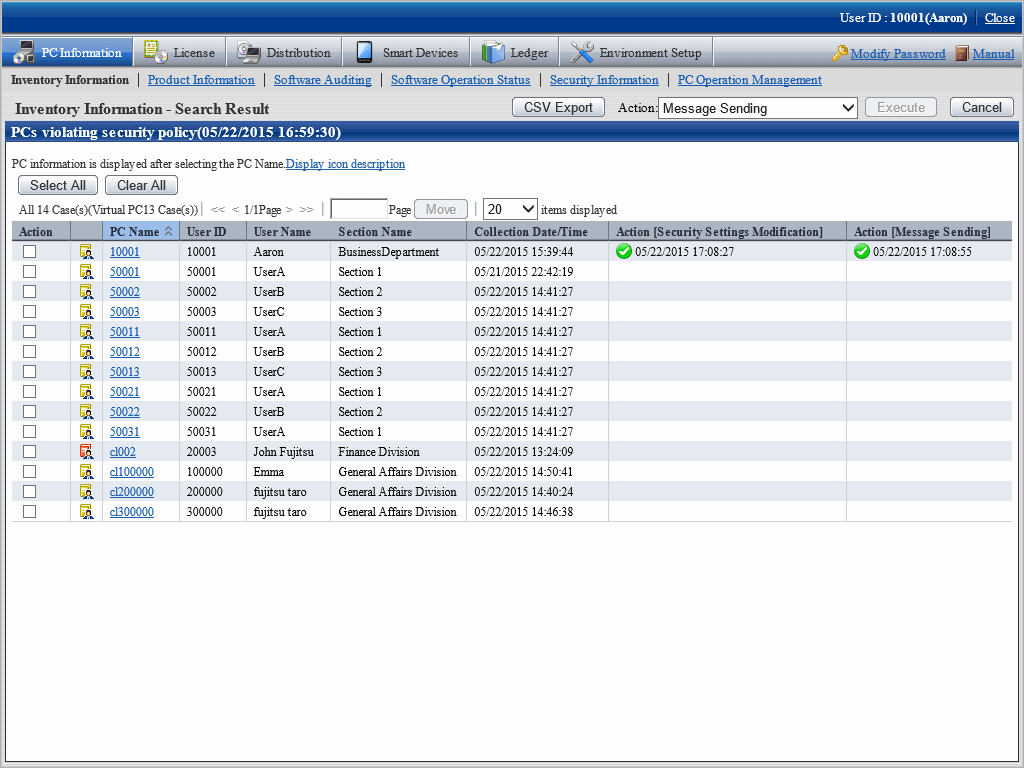
The content of items displayed as the result of processing result is as follows.
Item | Content | |
|---|---|---|
Status | The status of processing is displayed by the following icons. | |
| Processing has finished normally. | |
| Process has been failed. | |
| Unable to instruct a processing. | |
| Processing is being instructed. | |
Time of processing instruction | Display the time when processing is instructed. | |
Error content | When warning or exception occurs, output the error content. | |
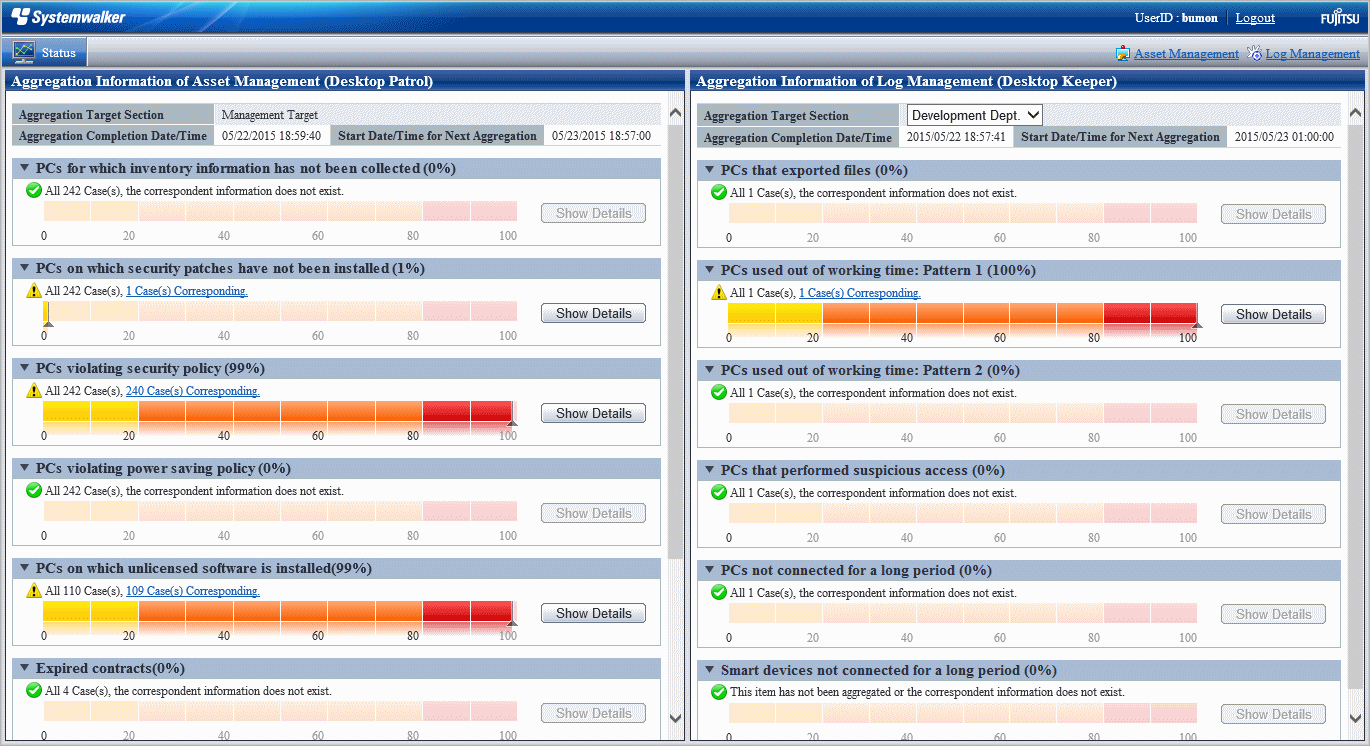
When Systemwalker Desktop Keeper has been installed, the asset management information of Systemwalker Desktop Patrol and log management information of Systemwalker Desktop Keeper will be displayed in the status window.
The status window when Systemwalker Desktop Keeper is installed is shown below.
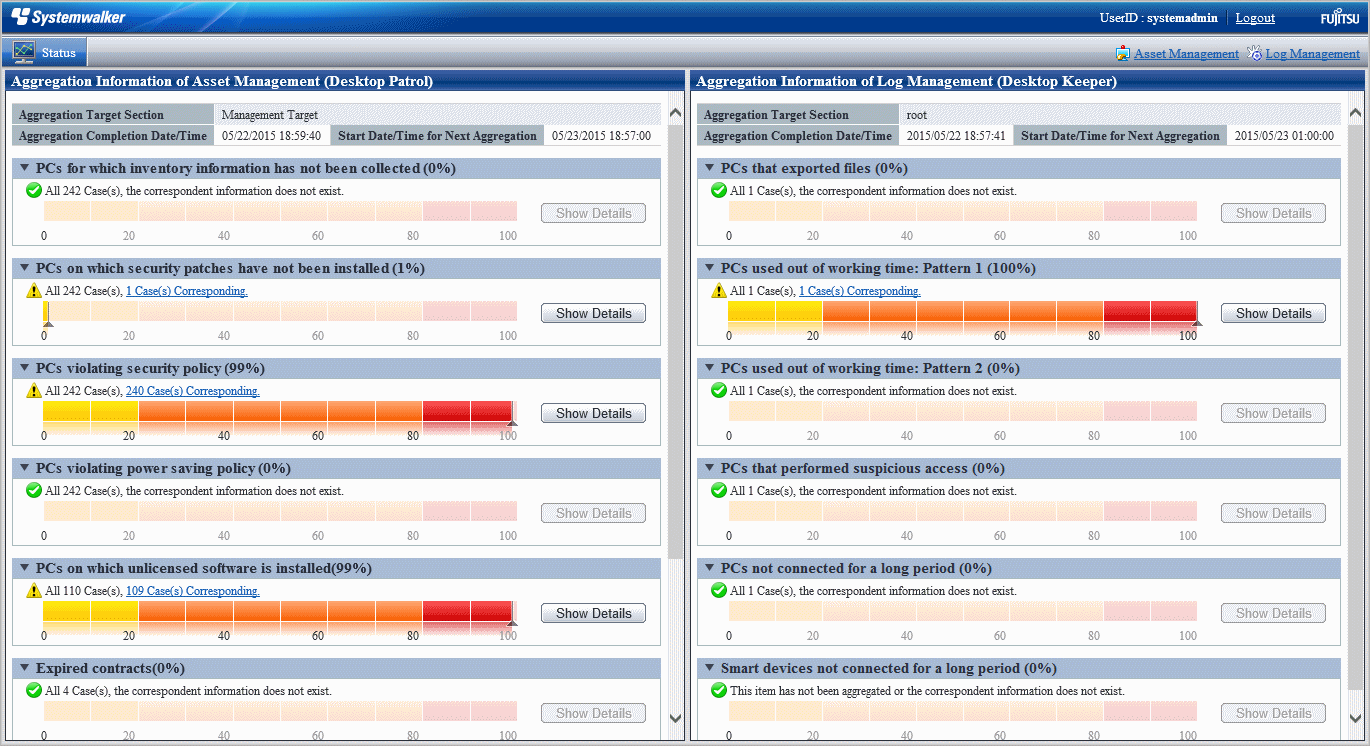
Click the link of Log Management of Global Navigation, or lick the link of each aggregation items displayed in the aggregation information of Log Management (Desktop Keeper), the window of Systemwalker Desktop Keeper can be displayed in another window.
No matter whether relevant specification exists in URL of Desktop Keeper of Environment Setup > Option > Settings of Status, consider the following causes when the aggregation information of Log Management (Desktop Keeper) is not displayed.
The URL specified in URL of Desktop Keeper of Environment Setup > Option > Settings of Status is incorrect
Specify a correct URL.
Even if the URL specified in URL of Desktop Keeper is correct, it cannot be accessed in the environment that uses browser
Check the setting of browser. If there is no problem in the setting of proxy server .etc, register the site (URL) of Desktop Keeper to Site of the zone of Local Intranet or Trusted Site.
The user ID or password used for login is not set for Systemwalker Desktop Keeper
Set the user ID and password of Systemwalker Desktop Keeper.
The user ID or password used for login is incorrect
Check the user ID and password registered in Systemwalker Desktop Keeper.
In addition, click Log Management of the Global Navigation, the above events will be output as message.
Note
At the time when displaying the status of Systemwalker Desktop Keeper or the window of Log Management, warning dialogs relating to security protection of Internet Explorer may be displayed sometimes, select to display even without protected items.
Automatic authentication of login ID (SSO)
On each product of Systemwalker Desktop Patrol and Systemwalker Desktop Keeper, management of user ID and password is required. When the user ID and password managed in each product are consistent, the status of each product can be displayed.
In addition, the login ID on Systemwalker Desktop Patrol is case-sensitive, but not on Systemwalker Desktop Keeper.
When logging in from Systemwalker Desktop Keeper, log in with the user ID of Systemwalker Desktop Patrol intentionally (case-sensitive). When the uppercase and lowercase are incorrect, the status of Systemwalker Desktop Patrol will not be displayed.
When the authorities of login ID on Systemwalker Desktop Patrol and Systemwalker Desktop Keeper are different
When performing the management of user ID and password in each product of Systemwalker Desktop Patrol and Systemwalker Desktop Keeper, different authority may be set for different products by mistake sometimes.
At this time, information will be displayed according to different authorities.
However, when the authority at Systemwalker Desktop Patrol side is "General User", the status window will not be displayed, and only the informant of product logged in will be displayed.
No | Login Side | Automatic Authentication Side | Displayed Content |
|---|---|---|---|
1 | "General User" of Systemwalker Desktop Patrol | Same IDs exist in Systemwalker Desktop Keeper | Only the information of Systemwalker Desktop Patrol will be displayed |
2 | Systemwalker Desktop Keeper | The same IDs exist as "General User" of Systemwalker Desktop Patrol | Only the information of Systemwalker Desktop Keeper will be displayed |