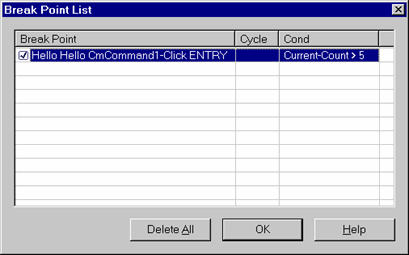
You may at any time review the current breakpoint status in an application by selecting Breakpoint List from the Debug menu. This will bring up a list of all currently specified breakpoints as follows:
Figure 7.8 The Breakpoint List dialog window
NOTE: You may also use the Breakpoint List icon - ![]() in the main Debugger window to bring up this list as well.
in the main Debugger window to bring up this list as well.
The Breakpoint List dialog box shows all breakpoints currently specified for the application. If there is a check mark in the check box to the immediate left of a breakpoint, it means that the breakpoint is currently active. If you wish to save a breakpoint specification, but need to deactivate it, simply uncheck the check box to the left of it.
To the right of a breakpoint you will see any related conditional breakpoints and/or cycle breakpoints currently specified.
If you wish to delete a breakpoint, right-click on it with the mouse and select Delete from the pop-up menu.
This same pop-up menu also allows you to access the breakpoint's properties, or to jump to the actual place in the application corresponding to the breakpoint. Note that "jump" does not mean execute. Instead, it means "show me the place in the code where this breakpoint is set".
Another related feature of the PowerCOBOL Debugger is the ability to force a break during application execution.
For example, if you select Go from the Debug menu, your application begins to execute quickly without showing you any of your source code statements.
If you have not set any breakpoints, your application will simply continue to execute until you close it. It you decide, however, that you need to break into the source code at a particular point in the execution phase, you can select Break from the Debug menu. This tells the Debugger to pause execution immediately.
If you currently have an Editor window open showing your procedure event source code, control will be returned back to this window and you may step through the source code statements.
If you do not have an Editor window open with the current event procedure source code, your application will be suspended. An Editor window is not opened automatically by selecting Break. If you want to step into the source code for the current event procedure, select Step Into from the Debug menu (or click on its corresponding icon).