PowerCOBOL provides a powerful and highly integrated debugger to assist in developing applications.
You must build an application in debug mode in order to use the Debugger on it. This is the default mode for a new application.
To select debug mode for building the application, you select and change the project's Build Mode property to 0-DebugMode. You can do this by highlighting the project name in the Project Manager and selecting the BuildMode Property in the right windowpane.
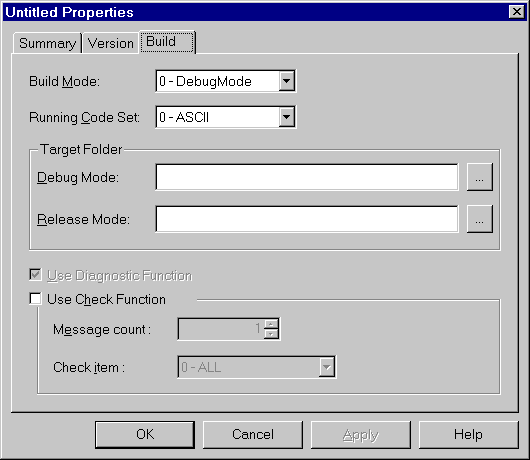
You may also select the BuildMode property by right clicking the mouse on the project name and selecting Properties from the pop-up menu. You will then be presented with a Properties dialog box from which you can select the Build tab as follows:
Figure 2.19 The Build tab in the application's Properties dialog box

You may then select the Build Mode dropdown list and ensure that 0-DebugMode is currently selected.
Once you have successfully built an application in debug mode, you are ready to start the application under the control of the Debugger.
You start the Debugger on an application by selecting the application module you wish to execute and selecting Debug from the Project menu or by right clicking on the module name and selecting Debug from the pop-up menu.
The Check function corresponds to the NetCOBOL compiler's "Check" function. It is typically used in debugging mode as it causes additional code to be generated by the compiler and performance is degraded as a result.
You should always rebuild your application when changing the Check option.
The following sub options are available under the Check function when enabled:
Sets the number of times certain runtime error messages are to be ignored, thus allowing execution to continue.
Selects the target to check.
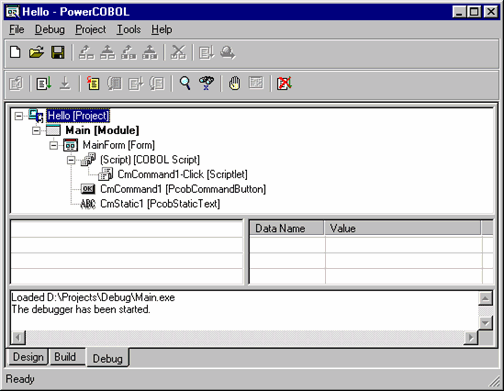
The Debugger initializes by creating a new Debug tab in the Project Manager window as follows:
Figure 2.20 The PowerCOBOL Debugger

The Debugger provides a hierarchical tree view of the application's components. It additionally provides an informational window area, a centralized data item watch (monitor) area, and a display area for the current application module and line of code where the execution is currently paused.
You may at any time step between the Debugger and the Build or Design facilities by left clicking the mouse on the appropriate tab near the bottom left corner of the Project Manager window.
This allows you to look at and modify application component properties dynamically during the debug process, for example.
Note that when the initial Debug tab is created as shown in Figure 2.15, the application has not yet begun to execute. This allows you to set initial breakpoints and data items to watch (monitor) before the application begins execution.
Once you are ready to begin execution, you may use either the Go or Step Into options from the Debug menu or click on their associated icons.
The Go option begins executing the application quickly without showing you the source code as it executes. Execution will continue until a breakpoint is encountered or until the user interface gains control and waits for the user to cause an application event.
The Step Into option will display the application's initial source code in a live edit session. You may then step a statement at a time and observe the source code as it executes (you may also select the Go option at any time while stepping).
If you have not specified any initial startup code in your application, the first thing you will typically see is the main form (window) in your application.
See Chapter 7, "Debugging the Program" for more details on using the Debugger.