This section explains how to identify the location of an error occurrence if the "/DEBUG" option was specified at the time of linkage to create a Program database file (PDB file), and if the program ends abnormally under the circumstances (see note below) that enable the PDB file to be referenced.
Note
The PDB file can be referenced under the following circumstances:
In a development environment, the PDB file can be referenced if it is in a folder output at the time of linkage.
In an operating environment, the PDB file can be referenced if it is in the same folder as the EXE file or the DLL file.
[LISTDBG.COB]
000010 IDENTIFICATION DIVISION.
000020  PROGRAM-ID. LISTDBG.
000030*
000040 DATA DIVISION.
000050  WORKING-STORAGE SECTION.
000060   01  culc.
000070     02  dividend  PIC 9(2).
000080     02  divisor   PIC 9(2).
000090   01  answer      PIC 9(2).
000100 PROCEDURE DIVISION.
000120     MOVE 2 TO dividend.
000130*
000140     CALL "DIVPROC" USING culc RETURNING answer.
000150*
000160     DISPLAY "answer =" answer.
000170     EXIT PROGRAM.
000180 END PROGRAM LISTDBG.
[DIVPROC.COB]
000010 IDENTIFICATION DIVISION.
000020  PROGRAM-ID. DIVPROC.
000030*
000040 DATA DIVISION.
000050  WORKING-STORAGE SECTION.
000060  LINKAGE SECTION.
000070   01  Al.
000080     02  dividend     PIC 9(2).
000090     02  divisor      PIC 9(2).
000100   01  answer         PIC 9(2).
000110*
000120 PROCEDURE DIVISION USING Al RETURNING answer.
000130*
000140     MOVE 0 TO answer.
000150     COMPUTE answer = dividend / divisor.
000160*
000190     EXIT PROGRAM.
000200 END PROGRAM DIVPROC.
Files
Clash Dump
Compiler listing specifying compiler option SOURCE, COPY and LIST
Program Database file (.PDB)
Debugging Tools
WinDbg (Debugging Tools for Windows - native x86)
Use the following methods to check whether a crash dump relates to the investigation target:
Check the crash dump filename.
The file name used for a crash dump collected by the Windows error report function is the name of the application that crashed. Check whether the crash dump filename is the name of the application being investigated.
Check the time of issue.
Check whether the crash dump update date and time is the time that the application ended abnormally.
Open the crash dump from WinDbg and identify the location of and the reason for the exception occurrence.
Start WinDbg.
From the WinDbg "File" menu, select "Open Crash Dump..." and open the investigation target crash dump.
[WinDbg output]
Loading Dump File [C:\ProgramData\Fujitsu\NetCOBOL\COBSNAP\LISTDBG_1720_20140801-155635_cobsnap.dmp]
User Mini Dump File with Full Memory: Only application data is available

Symbol search path is: *** Invalid ***
****************************************************************************
* Symbol loading may be unreliable without a symbol search path.           *
* Use .symfix to have the debugger choose a symbol path.                   *
* After setting your symbol path, use .reload to refresh symbol locations. *
****************************************************************************
Executable search path is:
Windows 7 Version 7601 (Service Pack 1) MP (2 procs) Free x86 compatible
Product: WinNt, suite: SingleUserTS
Machine Name:
Debug session time: Fri Aug  1 15:56:35.000 2014 (UTC + 9:00)
System Uptime: 0 days 4:35:31.089
Process Uptime: 0 days 0:00:01.000
......................................................
*** ERROR: Symbol file could not be found.  Defaulted to export symbols for ntdll.dll -

************* Symbol Loading Error Summary **************
Module name            Error
ntdll                  The system cannot find the file specified

You can troubleshoot most symbol related issues by turning on symbol loading diagnostics (!sym noisy) and repeating the command that caused symbols to be loaded.
You should also verify that your symbol search path (.sympath) is correct.
This dump file has an exception of interest stored in it.
The stored exception information can be accessed via .ecxr.
(1720.1108): Integer divide-by-zero - code c0000094 (first/second chance not available)                                                                       ... [1]
*** WARNING: Unable to verify checksum for LISTDBG.exe
*** ERROR: Symbol file could not be found.  Defaulted to export symbols for LISTDBG.exe -
eax=00000002 ebx=7ffdf000 ecx=00000000 edx=00000000 esi=00000000 edi=00406100
eip=00401516 esp=0012fd74 ebp=0012fe34 iopl=0         nv up ei ng nz na po cy
cs=001b  ss=0023  ds=0023  es=0023  fs=003b  gs=0000             efl=00010283
LISTDBG!DIVPROC+0x20e:                                                           ... [3]
00401516 f7f9            idiv    eax,ecx                                         ... [2]
[1] provides the reason the exception was issued: "Integer divide-by-zero - code c0000094" (zero divisor).
[2] provides the position of the exception occurrence:"00401516", the "idiv eax,ecx" instruction.
"idiv eax,ecx" is an instruction that performs signed division. The edx:eax register contents are divided by the ecx register contents, the quotient is set in eax, and the remainder is set in edx.
Use the r command to check the register contents.
[r command output]
0:000> r
eax=00000002 ebx=7ffdf000 ecx=00000000 edx=00000000 esi=00000000 edi=00406100
eip=00401516 esp=0012fd74 ebp=0012fe34 iopl=0         nv up ei ng nz na po cy
cs=001b  ss=0023  ds=0023  es=0023  fs=003b  gs=0000             efl=00010283
LISTDBG!DIVPROC+0x20e:
00401516 f7f9            idiv    eax,ecx
The above output indicates that "edx:eax=0000000000000002" was divided by "ecx=00000000" but, since ecx is 0, a zero divisor exception was issued.
Identify the COBOL source line position.
The position in the COBOL source where the error occurred, is indicated by [3], "LISTDBG!DIVPROC+0x20e".
The output format for the information at [3] is "module name!symbol name + offset". This information in this example is as follows:
Module name : "LISTDBG"
Symbol name : "DIVPROC"
Offset from Symbol : 0x20e
The extension is deleted from the module name. Use the lm command to check the extension.
[lm command output]
0:000> lm v m LISTDBG
start    end        module name
00400000 0040a000   LISTDBG  C (export symbols)       LISTDBG.exe
    Loaded symbol image file: LISTDBG.exe
    Image path: C:\work\tmp\tmp\LISTDBG.exe                            ... [4]
    Image name: LISTDBG.exe                                            ... [5]
    Timestamp:        Fri Aug 01 15:56:24 2014 (53DB3A18)
    CheckSum:         00000000
    ImageSize:        0000A000
    File version:     0.0.0.0
    Product version:  0.0.0.0
    File flags:       0 (Mask 0)
    File OS:          0 Unknown Base
    File type:        0.0 Unknown
    File date:        00000000.00000000
    Translations:     0000.04b0 0000.04e4 0409.04b0 0409.04e4
Check the file extension at [4], Image path, or [5], Image name. In this example,"LISTDBG.exe". is shown.
The symbol is formed by combining the COBOL source "PROGRAM-ID", the "CLASS-ID", and the "METHOD-ID". This is output as the label name in the object program list.
The two files LISTDBG.cob and DIVPROC.cob are used to create "LISTDBG.exe". For "LISTDBG!DIVPROC+0x20e", obtain the position "0x20e" from the Object Program Listing (DIVPROC.LST) of the DIVPROC.cob that contains the symbol "DIVPROC".
[Object Program Listing (DIVPROC.LST)]
BEGINNING OF DIVPROC
00000000 32                   db      0x32
00000001 07                   db      0x07
00000002 44495650524F43       dc      "DIVPROC"
00000009 08                   db      0x08
0000000A 4E6574434F424F4C     dc      "NetCOBOL"
00000012 07                   db      0x07
00000013 5631302E352E30       dc      "V10.5.0"
0000001A 3230313430383031     dc      "20140801"
00000022 3131343033393030     dc      "11403900"
0000002A 2B30303030           dc      "+0000"
0000002F 30313031             dc      "0101"
00000033 00                   db      0x00
00000034                 PROLOGUEAD:
00000034 XXXXXXXX             db      0xXXXXXXXX : PLB.1
00000038                 _DIVPROC:                                          ... [6]
00000038 55                   push    ebp
00000039 8BEC                 mov     ebp,esp
0000003B 81ECC0000000         sub     esp,000000C0
00000041 8BD7                 mov     edx,edi
00000043 8BFD                 mov     edi,ebp
00000045 81EF64000000         sub     edi,00000064
0000004B B90E000000           mov     ecx,0000000E
00000050 B800000000           mov     eax,00000000
00000055 FC                   cld
00000056 F3AB                 repe
00000058 8BFA                 mov     edi,edx
0000005A 897DEC               mov     ss:ebp-14,edi
0000005D 8975F0               mov     ss:ebp-10,esi
00000060 895DF4               mov     ss:ebp-0C,ebx
00000063 6800000000           push    00000000
00000068 C7859CFFFFFF00000000 mov     ss:ebp+FFFFFF9C,00000000
00000072 2EFF2534000000       jmp     cs:00000034
00000079 00000000000000       db      0x00000000000000
In the DIVPROC.cob Object Program Listing (DIVPROC.LST), search for "DIVPROC" to obtain the output position [6]. From the line address of the next line of that symbol, obtain the offset position of that symbol, "000000000038" (hexadecimal number).
Add the address number (offset) obtained above to the offset value from the symbol, "0x20e", to obtain the offset value within the list.
0x38+0x20e = 0x246
In the DIVPROC.cob Object Program Listing(DIVPROC.LST), search for address number "0x246 ".
[Object Program Listing(DIVPROC.LST)]
--- 14 --- MOVE 000001D0 B830300000 mov eax,00003030 000001D5 668945A0 mov ss:ebp-60,ax : answer --- 15 --- COMPUTE ... [8] 000001D9 31D2 xor edx,edx 000001DB 8B3D18000000 mov edi,%GWA+00000018 000001E1 8A17 mov dl,ds:edi : dividend 000001E3 83E20F and edx,0F 000001E6 31C9 xor ecx,ecx 000001E8 8A4F01 mov cl,ds:edi+01 : dividend+1 000001EB 83E10F and ecx,0F 000001EE 8D1492 lea edx,ds:edx+edx*4 000001F1 8D1451 lea edx,ds:ecx+edx*2 000001F4 8A4F01 mov cl,ds:edi+01 : dividend+1 000001F7 80E1F0 and cl,F0 000001FA 80F950 cmp cl,50 000001FD 75XX jne GLB.4 000001FF F7DA neg edx 00000201 GLB.4 000001FE 02 00000201 31C0 xor eax,eax 00000203 8B3D18000000 mov edi,%GWA+00000018 00000209 8A4702 mov al,ds:edi+02 : divisor 0000020C 83E00F and eax,0F 0000020F 31C9 xor ecx,ecx 00000211 8A4F03 mov cl,ds:edi+03 : divisor+1 00000214 83E10F and ecx,0F 00000217 8D0480 lea eax,ds:eax+eax*4 0000021A 8D0441 lea eax,ds:ecx+eax*2 0000021D 8A4F03 mov cl,ds:edi+03 : divisor+1 00000220 80E1F0 and cl,F0 00000223 80F950 cmp cl,50 00000226 75XX jne GLB.5 00000228 F7D8 neg eax 0000022A GLB.5 00000227 02 0000022A 66A30A000000 mov %GWA+0000000A,ax : TRLP+0 00000230 66891512000000 mov %GWA+00000012,dx : TRLP+0 00000237 0FBF0512000000 movsx eax,%GWA+00000012 : TRLP+0 0000023E 99 cdq 0000023F 0FBF0D0A000000 movsx ecx,%GWA+0000000A : TRLP+0 00000246 F7F9 idiv ecx ... [7] 00000248 668945DA mov ss:ebp-26,ax : TRLS+0 0000024C 0FBF45DA movsx eax,ss:ebp-26 : TRLS+0 00000250 B102 mov cl,02 00000252 B500 mov ch,00 00000254 8D7DA0 lea edi,ss:ebp-60 : answer 00000257 E8XXXXXXXX call JMPZNCVZB_REG1 |
The instruction at address "00000246 " (the instruction at [7]) is "idiv ecx", which matches the instruction obtained at [2]. Thus, the position of the instruction that ended abnormally can be identified as this one.
Search upwards from this instruction, looking for a line starting with the "--- nnn --- " format. In this example, "--- 15 --- COMPUTE " is found ([8]).
The part corresponding to the "nnn", that is "15", corresponds to the COBOL source line number.
In the DIVPROC.LST source program list, refer to the position at line number "15" ([9]).
[Source Program List(DIVPROC.LST)]
          1   000010 IDENTIFICATION DIVISION.
          2   000020 PROGRAM-ID. DIVPROC.
          3   000030*
          4   000040 DATA DIVISION.
          5   000050 WORKING-STORAGE SECTION.
          6   000060 LINKAGE SECTION.
          7   000070 01 Al.
          8   000080   02 dividend  PIC 9(2).
          9   000090   02 divisor   PIC 9(2).
         10   000100 01 answer      PIC 9(2).
         11   000110*
         12   000120 PROCEDURE DIVISION USING Al RETURNING answer.
         13   000130*
         14   000140     MOVE 0 TO answer.
         15   000150     COMPUTE answer = dividend / divisor.               ... [9]
         16   000160*
         17   000170     EXIT PROGRAM.
         18   000180 END PROGRAM DIVPROC.
This section explains how to identify the location where an error occurred if "/MAP" was specified at linkage to create a Link Map File, and if a program ended abnormally when it is impossible to reference the PDB file.
Files
Clash Dump
Compiler listing specifying compiler option SOURCE, COPY and LIST
Link Map file (.MAP)
Debugging Tools
WinDbg (Debugging Tools for Windows - native x86)
The example used here is the same as in "Locating Errors (Program Database File)".
A crash dump is collected when a file is executed if the file was created with "/MAP", rather than "/DEBUG", specified at the time of linkage.
Procedures 1. and 2. below are the same as in "Locating Errors (Program Database File)".
Check whether the crash dump relates to the investigation target.
Use the crash dump to identify the location of and the reason for the exception occurrence.
Identify the COBOL source line position.
The method for obtaining the COBOL source line position from the crash dump and the Link Map Listing is explained below.
Obtain the COBOL source line position from the WinDbg address information.
[Results output at WinDbg start]
Loading Dump File [C:\ProgramData\Fujitsu\NetCOBOL\COBSNAP\LISTDBG_1720_20140801-155635_cobsnap.dmp]
User Mini Dump File with Full Memory: Only application data is available

Symbol search path is: *** Invalid ***
****************************************************************************
* Symbol loading may be unreliable without a symbol search path.           *
* Use .symfix to have the debugger choose a symbol path.                   *
* After setting your symbol path, use .reload to refresh symbol locations. *
****************************************************************************
Executable search path is:
Windows 7 Version 7601 (Service Pack 1) MP (2 procs) Free x86 compatible
Product: WinNt, suite: SingleUserTS
Machine Name:
Debug session time: Fri Aug  1 15:56:35.000 2014 (UTC + 9:00)
System Uptime: 0 days 4:35:31.089
Process Uptime: 0 days 0:00:01.000
......................................................
*** ERROR: Symbol file could not be found.  Defaulted to export symbols for ntdll.dll -

************* Symbol Loading Error Summary **************
Module name            Error
ntdll                  The system cannot find the file specified

You can troubleshoot most symbol related issues by turning on symbol loading diagnostics (!sym noisy) and repeating the command that caused symbols to be loaded.
You should also verify that your symbol search path (.sympath) is correct.
This dump file has an exception of interest stored in it.
The stored exception information can be accessed via .ecxr.
(1720.1108): Integer divide-by-zero - code c0000094 (first/second chance not available)
*** WARNING: Unable to verify checksum for LISTDBG.exe
*** ERROR: Symbol file could not be found.  Defaulted to export symbols for LISTDBG.exe -
eax=00000002 ebx=7ffdf000 ecx=00000000 edx=00000000 esi=00000000 edi=00406100
eip=00401516 esp=0012fd74 ebp=0012fe34 iopl=0         nv up ei ng nz na po cy
cs=001b  ss=0023  ds=0023  es=0023  fs=003b  gs=0000             efl=00010283
LISTDBG!DIVPROC+0x20e:
00401516 f7f9            idiv    eax,ecx                                  ... [1]
This provides the abnormal end position of "00401516 " ([1]).
In order to identify the module held at the address "00401516 " at [1], use the lm command to output a module list.
[lm command output results]
0:000> lm
start    end        module name
002e0000 00324000   F3BIIO     (deferred)
00330000 00371000   F3BIFRM    (deferred)
00380000 003ca000   F3BIDBG    (deferred)
003d0000 003e5000   F3BIOLES   (deferred)
003f0000 003f5000   F3BIOVLD   (deferred)
00400000 0040a000   LISTDBG  C (export symbols)
LISTDBG.exe                                                               ... [2]
00420000 0045a000   F3BIOLER   (deferred)
00460000 004a2000   F3BISCRN   (deferred)
004b0000 00508000   F3BILPIO   (deferred)
00510000 0051e000   F3BISQL    (deferred)
00520000 00540000   F3BIPRIO   (deferred)
00540000 00551000   F3BISCLS   (deferred)
00560000 0056e000   F3BILANP   (deferred)
00570000 00588000   F3BIZCOM   (deferred)
005a0000 005ae000   F3BIAESV   (deferred)
005b0000 005dc000   F3BKATCH   (deferred)
005e0000 005f2000   F3BIEFNC   (deferred)
00600000 00636000   F3BIEXFH   (deferred)
00640000 00665000   F3BICICL   (deferred)
00670000 0067f000   F3BINDBC   (deferred)
006e0000 006f2000   F3BIFUNC   (deferred)
10000000 1006c000   F3BIPRCT   (deferred)
6c580000 6c6a2000   IMJP14K    (deferred)
6c6b0000 6c7c4000   IMJP14     (deferred)
71c90000 71ce1000   winspool   (deferred)
72170000 72177000   wsock32    (deferred)
72180000 7220e000   msvcp90    (deferred)
72410000 72494000   comctl32   (deferred)
72770000 72813000   msvcr90    (deferred)
74810000 74823000   dwmapi     (deferred)
74af0000 74b30000   uxtheme    (deferred)
750d0000 750d9000   version    (deferred)
75b40000 75bad000   sysfer     (deferred)
75bb0000 75bfc000   apphelp    (deferred)
75dc0000 75e0b000   KERNELBASE (deferred)
76000000 76057000   shlwapi    (deferred)
76060000 7606a000   lpk        (deferred)
76150000 76d9a000   shell32    (deferred)
76da0000 76e74000   kernel32   (deferred)
76e80000 76f4c000   msctf      (deferred)
76f50000 76ff2000   rpcrt4     (deferred)
77000000 77006000   nsi        (deferred)
77010000 770bc000   msvcrt     (deferred)
770c0000 7715d000   usp10      (deferred)
Since the "00401516 " at [1] is included in "00400000 0040a000 LISTDBG C (export symbols) LISTDBG.exe " at [2], we can identify that the abnormal end is in the "LISTDBG.exe" module.
The Link Map Listing created at the time of linkage using the "/MAP" specification can be used to identify the relevant part of the module.
[Link Map Listing(LISTDBG.MAP)]
LISTDBG

 Timestamp is 53db4524 (Fri Aug 01 16:43:32 2014)

 Preferred load address is 00400000                             ... [3]

Start         Length     Name                   Class
 0001:00000000 00003f1eH .text                   CODE
  ...
  Address         Publics by Value              Rva+Base     Lib:Object

 0001:00000000       $LISTDBG.CODE              00401000     LISTDBG.OBJ
 0001:00000000       _WinMain@16                00401000 f   LISTDBG.OBJ
 0001:000002d0       $DIVPROC.CODE              004012d0     DIVPROC.OBJ
 0001:00000308       _DIVPROC                   00401308 f   DIVPROC.OBJ    ... [4]
 0001:0000054a       _JMP1PLAN                  0040154a f   f3bicimp:F3BIPRCT.dll
...
Check whether the module loading address "400000" at [2] is the same as the address at [3], "Preferred load address is “00400000".
If module loading address at [2] and the address at [3] are the same
Compare the address "00401516" at [1] as is with the "Rva+Base" value and find the closest address that is smaller than the address at [1].
In this example, this is:
[4]" 0001:00000308 _DIVPROC 00401308 f DIVPROC.OBJ
Then, use the following calculation to obtain the symbol relative offset.
0x00401516 - 0x00401308 = 0x20e
The above results give the following information:
Module            : "LISTDBG.exe"
Symbol            : "DIVPROC"
Offset from Symbol: 0x20e
If module loading address at [2] and the address at [3] are different
Calculate the relative offset of each.
First, obtain the relative offset of the abnormal end position.
0x00401516 - 0x00400000 = 0x1516
Then obtain the relative offsets of the symbol of each.
main      0x00401000 - 0x00400000 = 0x1000
LISTDBG   0x00401000 - 0x00400000 = 0x1000
DIVPROC   0x00401308 - 0x00400000 = 0x1308   ... [5]
JMP1PLAN  0x0040154a - 0x00400000 = 0x154a
      :
Within the information shown above, find the offset that is closest to and smaller than the offset obtained at 1-.
In this example, this is:
[5]"DIVPROC 0x00401308 - 0x00400000 = 0x1308”
Then, use the following calculation to obtain the symbol relative offset.
0x1516 - 0x1308 = 0x20e
The above results give the following information:
Module            : "LISTDBG.exe"
Symbol            : "DIVPROC"
Offset from Symbol: 0x20e
Subsequent tasks are the same as in "Locating Errors (Program Database File)".
If the abnormal end location is a COBOL program or method, use the following to reference that program or method data:
Files
Clash Dump
Compiler listing specifying compiler option SOURCE, COPY and MAP
Debugging Tools
WinDbg (Debugging Tools for Windows - native x86)
Note
The only data that can be referenced at abnormal termination is the data used in the program or method that terminated abnormally.
Additionally, if the compile option OPTIMIZE is specified, the optimization process may mean that execution results have not been stored in a particular area and statements may have been moved or deleted. For this reason, examining data areas may not be reliable.
1) Retrieving base addresses of sections
You can find the base address of each section by using the link map listing and the debugger. The following describes where you can find each section.
Located in the link map listing at the address in the Rva+Base column on the line where the “Publics by Value” column is ‘$program-name.LIT’. [1] in the sample link map listing below.
Located in the link map listing at the address in the Rva+Base column on the line where the “Publics by Value” column is ‘$program-name.DATA’. [2] in the sample link map listing below.
Located in the link map listing at the address in the Rva+Base column on the line where the “Publics by Value” column is ‘$program-name.BSS’. [3] in the sample link map listing below.
Represents the EBP register. Find the address in this register using the debugger.
The base address of HGW is stored in the BHG pointer. Reference the program control information listing to find the location of the BHG pointer, then use the debugger to obtain the address in the BHG pointer - this is the base address of HGW. [4] in the sample program control information listing below.
The base address of HPA is stored in the BOD pointer. Reference the program control information listing to find the location of the BOD pointer, then use the debugger to obtain the address in the BOD pointer - this is the base address of HPA. [5] in the sample program control information listing below.
Sample link map listing, for a program called “A”:
Start         Length     Name                   Classv
0001:00000000 000043a2H .text                   CODE
          :
0003:00000030 00002580H .data                   DATA
0003:000025b0 0000052cH .bss                    DATA
0004:00000000 0000025cH .rodata                 DATA
         :
  Address         Publics by Value              Rva+Base     Lib:Object
         :
 0001:00000000       $A.CODE                    00401000     A.OBJ
 0001:00000000       _main                      00401000 f   A.OBJ
         :
0003:00000030       $A.DATA               [2]  00406030     A.OBJ
         :
0004:00000000       $A.BSS                [3]  00409f00     A.OBJ
         :
0005:00000000       $A.LIT                [1]  0040a000     A.OBJ
         :
The BHG and BOD pointers are found in the SGM POINTERS AREA in the program control information listing as illustrated in the following sample:
    ** STK **
      * SCB *
EBP+FFFFFF40          SCB FIXED AREA                     92
     ........          TL 1ST AREA                         0
      * SGM *
EBP+FFFFFF98          SGM POINTERS AREA                   8
     ........            VPA                               0
     ........            PSA                               0
     ........            BVA                               0
EBP+FFFFFF98       [5]  BOD                               4
EBP+FFFFFF9C       [4]  BHG                               4.
:2) Retrieving the data address
You obtain information on the data address from the data map listing. For details on data map listing format, see the sections “Format of Data Map Listing” and “Data Map Listing Description” in "5.7.4.1 Data Map Listing".
Note
Data map listing addresses and offsets are written in hexadecimal, Big Endian, format. Addresses stored in memory are written in Little Endian format, but the debugger expects addresses to be entered in Big Endian format. Therefore the byte order of addresses read from memory must be reversed before being used, E.g. an address stored in 4 bytes of memory will appear as F8 C4 35 00, but the address is 00 35 C4 F8 and this is the number to use when adding offsets or entering into the debugger’s address entry field.
Here is a sample data map listing.
LINE  ADDR    OFFSET REC-OFFSET LVL NAME   LENGTH ATTRIBUTE BASE      DIM
**LISTDBG1**
  6  GWA+000000E8             0 01 answer       2 EXT-DEC   BGW.000000
  7  GWA+000000EA             0 01 divisor      2 EXT-DEC   BGW.000000
  9 [GWA+00000020]+00000000   0 01 dividend     2 EXT-DEC   BVA.000001
10 [HGW+00000024]+00000000   0 01 dynamic-area 2 EXT-DEC   BVA.000002
The location of the data is found in the ADDR and OFFSET columns (entries of the form “XXX+number” or “[XXX+number-1]+number-2”). The length of the stored data is given in the LENGTH column. In the above example:
Data Item | Data Stored at | Data Area Length |
|---|---|---|
answer | Stored at the address produced by adding 000000E8 to the GWA base address. | 2 bytes |
divisor | Stored at the address produced by adding 000000EA to the GWA base address | 2 bytes |
dividend | The square brackets indicate that the (four-byte) base address of the data is stored at the location produced by adding 00000020 to the GWA base address. The data is stored at the location produced by adding the offset (in this case, 0000000) to this address. | 2 bytes |
dynamic-area | The square brackets indicate that the (four-byte) base address of the data is stored at the location produced by adding 00000024 to the HGW base address. The data is stored at the location produced by adding the offset (in this case, 00000000) to this address. | 2 bytes |
3) Examining data values
Having derived the address(es) of the data in step 2 above, you can now use the debugger to examine the contents.
(Remember the note on reading addresses from memory given under step 3!)
Start the Debugging Tools for Windows.
From the File menu, select the Open Crash Dump command to open the Crash dump.
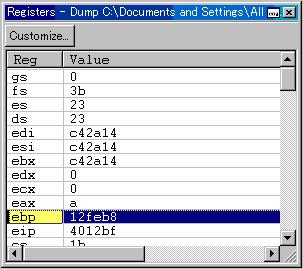
To examine the registers, from the View menu, select the Registers command. The Registers window is displayed. This snapshot shows the EBP register and value highlighted:
To examine memory, from the View menu, select the Memory command and enter the address to be referenced in the “Virtual” entry field. The following examples show how addresses are entered and data values examined.
Example
Example 1: Examining the "divisor" data item
The information of "divisor" in our example data map listing is as follows:
7 GWA+000000EA 0 01 divisor 2 EXT-DEC BGW.000000
The link map file shows the GWA base address to be 00406030.
We can let the debugger add the offset (0xEA) to the base address for us by entering “00406030+EA” in the address bar:
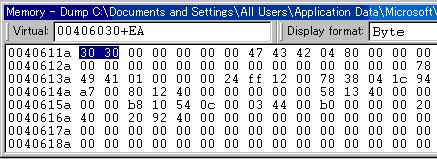
The debugger positions you at the resulting address. The above snapshot shows the 2 byte value of “divisor” to be 0x3030 (we added the highlighting by selecting the two bytes - the debugger doesn’t “know” that the data item at this offset is 2 bytes long - and similarly in the following examples).
Example 2: Examining the "dividend" data item
The information of "dividend" in our sample data map listing is as follows:
9 [GWA+00000020]+00000000 0 01 dividend 2 EXT-DEC BVA.000001
In an indirect reference such as this, the actual address of the data item is stored at the location indicated by [GWA+00000020].
As in example 1, the GWA base address is 00406030, so we enter 00406030+20 in the address bar:
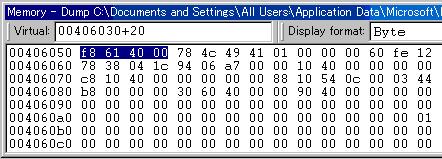
The four bytes at this address (highlighted) make up the address of the “dividend” data item. However, remember that addresses stored in memory are in reverse byte order, To derive the address in the Big Endian format used for entering the data we must reverse the order of the bytes: 004061f8.
The “dividend" data content is stored at 004061f8+00000000. So we enter the address 004061f8 in the address bar. (+0000000 is omitted.)
This shows the data content of the “dividend” data item to be 0x3130.
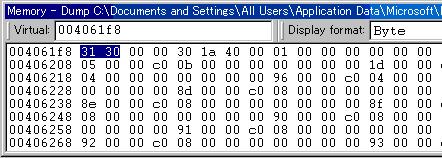
Example 3: Examining the "dynamic-area" data item
The information of "dynamic-area" in our sample data map listing is:
10 [HGW+00000024]+00000000 0 01 dynamic-area 2 EXT-DEC BVA.000002
Because the HGW base address is stored in the BHG pointer we must first find that value. From the program control information listing we find that BHG is at the address EBP+FFFFFF9C. So, we first enter EBP+FFFFFF9C in the address bar (the debugger accepts register names as part of the address expressions):
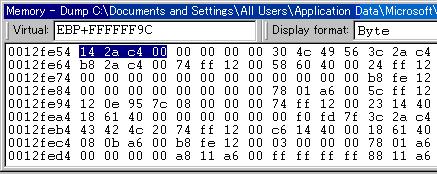
This shows that the HGW base address is 00c42a14.
Next, we look up the actual address stored at [HGW+00000024]. We therefore enter 00c42a14+24 in the address bar:

So the (base) address for the “dynamic-area” item is 00406118.
The content of “dynamic-area” is stored at 00406118+00000000. We enter 00406118 in the address bar. (+0000000 is omitted.)
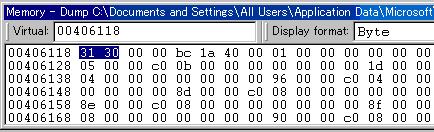
This shows the data content of “dynamic-area” to be 0x3130.
Similarly, in the case of an address based on HPA such as: [HPA+xxxxxxxx]+yyyyyyyy,
we start with the BOD pointer to obtain the HPA base address and go on to examine the variable area.