The COBOL Error Report writes diagnostic information to a report file.
The report file name is "Applicaton-name_ProcessID_Error-occurrence-time" with the extension LOG.
Example
Application name            :  TESTPGM.EXE
Process ID                  :  2D8
Error occurrence time       :  2009.07.10 15:04:26
Diagnostic report file name :  TESTPGM_2D8_20090710-150426.LOG
The standard output destination for diagnostic reports is \Fujitsu\NetCOBOL\COBSNAP under the user common application data folder (the folder on each computer where application-specific data is stored).
Generally the diagnostic reports output destination is created using the following names:
C:\ProgramData\Fujitsu\NetCOBOL\COBSNAP
To change the output destination folder, specify the "-r" start parameter. Refer to "5.6.3.4 Start parameters" for details of start parameters.
Note
The user common application data folder is usually a read-only folder. The following access authority to the Everyone group is necessary for the folder that outputs the diagnostic report.
Modify
Read & execute
List folder contents
Read
Write
The COBOL Error Report writes the occurrence of each event to the message box and to the application event log file.
In the message box, a message indicating the event occurrence and a message inquiring whether to open the diagnostics report are output. Clicking the [Yes] button in the message box opens the diagnostics report.
Note
If the application is operated as a background service, the diagnostic report cannot be opened from the message box.
Each event log is designated by NetCOBOL SNAP as a source name, a message number as an event ID, a severity code as a type, and a message body as an explanation. The severity codes of the COBOL Error Report messages and the event log types are associated as shown below to accommodate differences in level classifications between the system and the COBOL Error Report.
Severity code | Event log type |
|---|---|
I (INFORMATION) | INFORMATION |
W (WARNING) | WARNING |
E (ERROR) | |
U (UNRECOVERABLE) | ERROR |
The event occurrence report is directed by default to the message box. Use the start parameter -l to change the destination. For details about the start parameters, refer to "5.6.3.4 Start parameters".
If diagnostic report output fails, for example, due to inadequate disk space, an error message is issued to the event output destination.
Note
Many services do not perform I-O from screens. If event logs are used under a service that does not perform I-O from screens, specify the “-l” start parameter and specify the event log as the event notification destination.
The COBOL Error Report generates the following items of information in a diagnostic report:
Summary
A summary of the diagnostic information
Event detected
A diagnostic report always begins with the following line:
The application error occurred:
or
The COBOL runtime message occurred:
or
Diagnosed an application with no response:
Application
The application name (absolute path name format) and process ID (hexadecimal)
Exception number
When an application error occurs, an exception code (hexadecimal) and exception name are generated. For details about the exception code and exception name, refer to "Table 5.6 Exception codes and exception names". When a runtime message occurs, its body is generated. No information is generated for an application that does not respond.
Generation time
When an application error or runtime message occurs, the date and time when the error occurred is generated. For no response, the date and time when the COBOL Error Report was started is generated.
Generation module
When an application error or runtime message occurs, the name of the module in which the error occurred (absolute path name), its creation time, and file size are generated. No information is generated for an application that does not respond.
Detail
When an application error or runtime message occurs, the location at which the error occurred is generated. No information is generated for an application that does not respond.
Thread ID
The thread ID (hexadecimal) of the thread in which the error occurred
Register
A listing of the register values (hexadecimal) in effect when the error occurred
Stack commit
The state of the stack (all in hexadecimal) when the error occurred
Commit size
Allocated stack size (Commit size = top address - base address)
Top address
Highest-order address of stack
Base address
Lowest-order address of allocated stack
Instruction
The machine language codes (hexadecimal) 16 bytes before and after the error location
Module file
The name, in absolute path format, of the module in which the error occurred
Section relative position
The relative location (hexadecimal) of the module from the beginning of the .text section
Export relative position
If the module has export information, the export name having its address closest to the error location and the relative value (hexadecimal) from the beginning of the export name are generated.
The export name of a COBOL program is shown below:
External program :  External program name
ENTRY            :  Entry name
Class            :  _class name_FACTORY
Method           :  __class name_method name@###, or
                    __class name__ENTRY_method name@###
Method (PROPERTY):  __class name__GET_method name@###,
                    __class name__SET_method name@###,
                    __class name__ENTRY__GET_method name@###, or
                    __class name__ENTRY__SET_method name@###
The export name of a non-COBOL program is shown below:
Function: Function name or _function name@###
The "###" of "@###" following the method name or function name is a decimal value representing the parameter byte count.
When no symbol name or program name is generated, the compilation unit can be identified from the export name if an export name has been defined for each compilation unit.
Symbol relative position
If the module has COFF symbol information, the symbol name and the relative value (hexadecimal) from the beginning of the symbol name are generated.
The symbol name of a COBOL program is a compilation unit name. The compilation unit names of COBOL programs are shown below.
External program :  External program name
Class            :  Class name
Method           :  Class name_method name
Method (PROPERTY):  Class name_GET_method name , or
                    class name_SET_method name
Compilation information
For a COBOL program, the information at program compilation is generated. For a non-COBOL program, this information is not generated.
Code system (ASCII or Unicode)
Object format (single thread or multithread)
Optimization (OPTIMIZE or NOOPTIMIZE)
Program name
For a COBOL program, the external program name or class name and the internal program name or method name are generated. For a non-COBOL program, this information is not generated.
Source file
The name of the source file of the program that caused the error is generated.
Source line
The line number of the statement that caused the error is generated.
Supplementary information
In a COBOL program, if an error is located in a statement in a declarative section procedure, the source statement branching to the declarative section is listed; if not, no supplementary information is generated.
Call stack
The calling path up to the program that caused the error is generated. If there is no debugging information file, the caller of the internal program is not generated.
System information
General system information about the computer is generated.
Computer name
User name
Windows version
Version number
Service pack
Command line
The command character string in effect when the application was run
Environment variable
The environment variable setting in effect when the application was run
Execution environment information
The items of COBOL execution environment information that are generated are listed below. If an initial file does not exist, "NONE" is generated in the place of the initial file name and the program name. If an initial file exists and the program is running in multithread mode, "NONE" is generated in the place of the program name.
Runtime system
The version and module type of COBOL runtime system.
Runtime mode
The information at execution of the runtime system
Code system (ASCII or Unicode)
Operating mode (single thread or multithread)
Program name
The main program of COBOL recognized by the runtime system (corresponds to the section name in the initial file)
.CBR file
The name (absolute path name) and contents of the runtime initial file referenced by the runtime system
Various information files
The names (absolute path name) and contents of the following information files
Entry information file
Logical destination definition file
ODBC information file
Print information file
STACK/HEAP information
The size of the stack and heap (hexadecimal) specified at executable file linkage time
Task list
A listing of the process IDs (hexadecimal) and application names of the tasks running on the system
Module list
A listing of each module loaded by the application, including the file name, version information, and creation time. Lists are generated in the order in which the modules were loaded.
Stack summary
The summarized stack information is generated as follows: (No internal program stack information is generated.)
Frame pointer
Leading address (hexadecimal) of the stack frame of the called program
Return address
Return address (hexadecimal) of the called program
Parameter
Parameters (hexadecimal) passed to the called program
Module file name and program name
Module file name and program name of the called program
For a parameter, the memory contents of the location (frame pointer + 8 bytes) where the parameter is stored on the stack are listed.
Stack dump
The contents of the stack when the error occurred are listed using hexadecimal and ASCII notation
Thread information
When an application error or runtime message occurs, the items of information listed below are generated with regard to the threads other than the thread in which the error occurred. For an application that does not respond, these items of information are generated for each thread that has been created by the application.
Thread ID
Register
Stack commit
Module file
Section relative position
Export relative position
Symbol relative position
Compilation information
Program name
Source file
Source line
Call stack
Stack summary
Stack dump
The exception codes defined in the system and the exception names for the exception codes that are included in the diagnostic report are listed in "Table 5.6 Exception codes and exception names".
Code | Exception name |
|---|---|
Explanation | |
C0000005 | EXCEPTION_ACCESS_VIOLATION |
The program attempted to read or write to a virtual address, but the program did not have the appropriate access authority. | |
C0000006 | EXCEPTION_IN_PAGE_ERROR |
The system failed to load a nonexistent page as the program attempted to access it. | |
C0000017 | EXCEPTION_NO_MEMORY |
It failed in the allocation of the memory because of memory shortage or the heap destruction. | |
C000001D | EXCEPTION_ILLEGAL_INSTRUCTION |
The program attempted to execute an instruction undefined in the processor. | |
C0000025 | EXCEPTION_NONCOUNTINUABLE_EXCEPTION |
The program attempted to rerun in the wake of an irrecoverable exception. | |
C0000026 | EXCEPTION_INVALID_DISPOSITION |
An exception handler returned an invalid array to the exception dispatcher. | |
C000008C | EXCEPTION_ARRAY_BOUNDS_EXCEEDED |
An attempt by the program to access an array out of bounds was detected by the hardware. | |
C000008D | EXCEPTION_FLT_DENORMAL_OPERAND |
One of the operands of a floating-point arithmetic calculation is abnormal. This value is too low to be represented as a standard floating-point value. | |
C000008E | EXCEPTON_FLT_DIVIDE_BY_ZERO |
The program attempted to divide a given floating-point value by a floating-point value of 0. | |
C000008F | EXCEPTION_FLT_INEXACT_RESULT |
The result of a floating-point arithmetic calculation cannot be accurately represented as a decimal. | |
C0000090 | EXCEPTION_FLT_INVALID_OPERATION |
This exception represents a floating-point exception other than the one defined in this table. | |
C0000091 | EXCEPTION_FLT_OVERFLOW |
The value of the exponent part of a floating-point arithmetic calculation exceeds the upper limit of the corresponding type. | |
C0000092 | EXCEPTION_FLT_STACK_CHECK |
A stack overflow or underflow resulted from a floating-point arithmetic calculation. | |
C0000093 | EXCEPTION_FLT_UNDERFLOW |
The value of the exponent part of a floating-point arithmetic calculation exceeds the lower limit of the corresponding type. | |
C0000094 | EXCEPTION_INT_DIVIDE_BY_ZERO |
The program attempted to divide an integer by 0. | |
C0000095 | EXCEPTION_INT_OVERFLOW |
The most significant bit of an integer calculation overflowed. | |
C0000096 | EXCEPTION_PRIV_INSTRUCTION |
The program attempted to execute an instruction but the calculation is not supported in the current machine mode. | |
C00000FD | EXCEPTION_STACK_OVERFLOW |
A stack overflow occurred. |
Common application errors in COBOL applications are access violation errors (EXCEPTION_ACCESS_VIOLATION) and zero division errors (EXCEPTION_INT_DIVIDE_BY_ZERO). The following are the possible causes of access violation errors:
Subscript or index values are outside the scope.
Reference modification pointer values are outside the scope.
The calling conventions or number of parameters between calling and called programs did not match.
The CHECK function can be used to easily detect these errors. If an error occurs, use the CHECK function to check. Refer to "5.2 Using the CHECK Function".
The output format of the source file names and line numbers of COBOL programs varies depending on the specification of the compiler options NUMBER and OPTIMIZE. The relationships between the compiler options and output formats are summarized in "Table 5.7 Compiler options and output formats".
Output object | NOOPTIMIZE option | OPTIMIZE option | ||
|---|---|---|---|---|
NUMBER/NONUMBER options | NUMBER option | NONUMBER option | ||
Source file name | Source file | File name only | ||
Library file | File name only | Not generated | File name only | |
Path of library reading | The file name of the library file read, the file name of the source file, and the line numbers in the source file are generated up to the end of the calling path (*3). | Not generated (source file name generated). (*4) | The file name of the library file read and that of the source file are output, but not the source line numbers (*5). | |
Line numbers | In the entry code (*1) | IN ENTRY-CODE | ||
In the exit code (*2) | IN EXIT-CODE | |||
Statement | File-relative-line-number [in-line-sequence-number] | [COPY-qualification-value-]editor-line-number(NUMBER) (*6) | File-relative-line-number | |
[Supplementation with term]
*1
"In the entry code" means the range of the entry code of the program from the position PROLOGUEAD: +4 (hexadecimal) to END OF PROGRAM INITIALIZE ROUTINE in the object program listing.
*2
"In the exit code" means the range of the exit code of the program from the position BEGINNING OF GOBACK COMMON ROUTINE to END OF GOBACK COMMON ROUTINE in the object program listing.
[Output Sample]
*3
Source File:  CPY2.cbl <- CPY1.cbl <- SRC.cob
Source Line:  86 <- 55 <- 127
*4
Source File:  SRC.cob
Source Line:  2-8600 (NUMBER)
*5
Source File:  CPY2.cbl <- SRC.cob
Source Line:  86
*6
An identifier (NUMBER) placed right after a line number identifies the line number as an editor line number or as a file relative line number.
Source Line: 95100 (NUMBER)
Summary
A summary of the diagnostic information
Event detected
A diagnostic report always begins with the following line:
Watched the writing of an area:
Application
The name of the application (absolute path name) and process ID (hexadecimal)
Starting time
The date and time when the COBOL Error Report started
Watch address
The address (hexadecimal) of the watch area
Watch size
The size (decimal) of the watch area
Write information items
The locations in the watch area where writing occurred and the contents of the area after writing are listed in the order writing occurred. If writing to the watch area did not occur, information indicating this is generated in the diagnostic report.
Counter
Incremented each time information is output. These values can be used to identify the order of writing.
Watch area
The watch area contents in hexadecimal notation are generated.
Write location
The location of writing
Thread ID
Module file
Section relative position
Export relative position
Symbol relative position
Compilation information
Program name
Source file
Source line
Call stack
If an application error or runtime message occurs during an area destruction watch, the following information will be added to the diagnostic report:
Error information
Information related to the application error or runtime message
Counter
Values incremented each time information is output
Error summary
Detected event and error code
Problem location
Location where the error occurred
Thread ID
Register
Stack commit
Module file
Section relative position
Export relative position
Symbol relative position
Compilation information
Program name
Source file
Source line
Call stack
This section explains how to troubleshoot using diagnostic reports generated by the COBOL Error Report, with reference to examples.
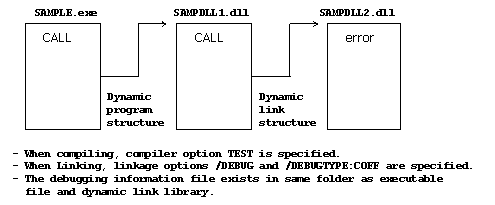
An example of a diagnostic report generated to report an application error is shown below.
The program used by the example is composed of the following program.
NetCOBOL COBOL ERROR REPORT

<<Summary>>
The application error occurred:
  Application        : D:\APL\SAMPLE.exe(PID=000000A7)
  Exception Number   : EXCEPTION_INT_DIVIDE_BY_ZERO(C0000094)
  Generation Time    : MM/DD/YYYY(HH:MM:SS)
  Generation Module  : D:\APL\SAMPDLL2.dll
  Time Stamp         : MM/DD/YYYY(HH:MM:SS)
  File Size          : 30720bytes

<<Detail>>
  Thread ID    : 0000005E
  Register     : EAX=00000000 EBX=7FFDF065 ECX=00000000 EDX=00000000 ESI=001421A6
               : EDI=00405108 EIP=03BB125D ESP=0012FCD8 EBP=0012FD98 EFL=00010256
               : CS=001B  SS=0023  DS=0023  ES=0023  FS=0038  GS=0000
  Stack Commit : 00004000 (Top:00130000, Base:0012C000)
  Instruction  : Address  +0 +1 +2 +3 +4 +5 +6 +7 +8 +9 +a +b +c +d +e +f
                 03BB124D 03 0F BF 05 32 50 BB 03 99 0F BF 0D 2A 50 BB 03
         FAULT ->03BB125D F7 F9 0F BF C8 83 F9 00 7D 02 F7 D9 0F C9 C1 E9

  Module File : D:\APL\SAMPDLL2.dll
  Section Relative Position : .text+0000025D
  Export Relative Position : SAMPDLL2+00000229
  Symbol Relative Position : SAMPDLL2+0000025D
  Compilation Information : ASCII, SINGLE THREAD, NOOPTIMIZE
  External Program/Class : SAMPDLL2
  Source File : SAMPDLL2.cob
  Source Line : 35

<Call Stack>
[ 1]---------------------------------------------------------------------
  Module File : D:\APL\SAMPDLL1.dll
  Section Relative Position : .text+0000026B
  Export Relative Position : SAMPDLL1+00000237
  Symbol Relative Position : SAMPDLL1+0000026B
  Compilation Information : ASCII, SINGLE THREAD, NOOPTIMIZE
  External Program/Class : SAMPDLL1
  Source File : SAMPDLL1.cob
  Source Line : 14
[ 2]---------------------------------------------------------------------
  Module File : D:\APL\SAMPLE.exe
  Section Relative Position : .text+0000047A
  Symbol Relative Position : SAMPLE+0000047A
  Compilation Information : ASCII, SINGLE THREAD, NOOPTIMIZE
  External Program/Class : SAMPLE
  Source File : SAMPLE.cob
  Source Line : 24
[ 3]---------------------------------------------------------------------
  Module File : D:\APL\SAMPLE.exe
  Section Relative Position : .text+0000000A
  Symbol Relative Position : SAMPLE+0000000A
[ 4]---------------------------------------------------------------------
  Module File : D:\APL\SAMPLE.exe
  Section Relative Position : .text+00000BEB
  Symbol Relative Position : _WinMainCRTStartup+0000014B
[ 5]---------------------------------------------------------------------
  Module File : C:\WINDOWS\System32\KERNEL32.dll
  Section Relative Position : .text+0001A623
  Export Relative Position : RegisterWaitForInputIdle+00000117
Omitted hereafter
Note <<Summary>>. Reports which application error has occurred and in which module.
This example shows that a division by 0 exception has occurred in D:\APL\SAMPDLL2.DLL.
Then view <<Detail>>. Reports in which compilation unit the error has occurred.
This example shows that an error has occurred on line 35 in the program SAMPDLL2.
Identify in which statement (instruction) the error occurred from the source file of the affected program or from the object program listing.
This example assumes that the error has occurred in the COMPUTE statement on line 35.
Further, the calling path up to the error-affected program indicates the program calling relationship.
In this example, the program SAMPDLL2 has been called from the program SAMPDLL1 in the module SAMPDLL1.DLL and SAMPDLL1 has been called from the program SAMPLE in the module SAMPLE.EXE.
Run the interactive debugger to collect detailed information about the error. Proceed with debugging by rebuilding the error-affected program and, if necessary, programs appearing in the calling path.
An example of a diagnostic report generated to report a runtime message is shown below.
The program used by the example is composed of the following program.

NetCOBOL COBOL ERROR REPORT

<<Summary>>
The COBOL runtime message occurred:
  Application       : D:\APL\SAMPLE.exe(PID=000000BB)
  Exception Number  : JMP0311I-U [PID:00000CB4 TID:0000034C] MISSING ALLOCATION. FILE=SYS001. PGM=SAMPDLL2 LINE=31
  Generation Time   : MM/DD/YYYY(HH:MM:SS)
  Generation Module : D:\APL\SAMPDLL2.dll
  Time Stamp        : MM/DD/YYYY(HH:MM:SS)
  File Size         : 66336bytes

<<Detail>>
  Thread ID    : 0000034C
  Register     : EAX=0012E238 EBX=1C044B18 ECX=E9999999 EDX=00050001 ESI=00000000
               : EDI=00161EEC EIP=7C812A5B ESP=0012E234 EBP=0012E288 EFL=00000246
               : CS=001B  SS=0023  DS=0023  ES=0023  FD=0038  GS=0000
  Stack Commit : 00005000 (Top:00130000, Base:0012B000)
  Instruction  : Address  +0 +1 +2 +3 +4 +5 +6 +7 +8 +9 +a +b +c +d +e +f
                 7C812A4B 8D 7D C4 F3 A5 5F 8D 45 B0 50 FF 15 08 15 80 7C
         FAULT ->7C812A5B 5E C9 C2 10 00 85 FF 0F 8E 36 93 FF FF 8B 55 FC

  Module File : D:\APL\SAMPDLL2.dll
  Section Relative Position : .text+0000029A
  Export Relative Position : SAMPDLL2+00000262
  Symbol Relative Position : SAMPDLL2+0000029A
  Compilation Information : ASCII, SINGLE THREAD, NOOPTIMIZE
  External Program/Class : SAMPDLL2
  Source File : SAMPDLL2.cob
  Source Line : 31

<Call Stack>
[ 1]---------------------------------------------------------------------
  Module File : c:\Program Files\Fujitsu NetCOBOL for Windows\F3BKATCH.dll
  Section Relative Position : .text+00002A1A
  Export Relative Position : NotifyExecErrorInfo+0000015E
[ 2]---------------------------------------------------------------------
  Module File : c:\Program Files\Fujitsu NetCOBOL for Windows\F3BIPRCT.dll
  Section Relative Position : .text+0000BEF8
  Export Relative Position : JMP1MESS+00000B58
[ 3]---------------------------------------------------------------------
  Module File : c:\Program Files\Fujitsu NetCOBOL for Windows\F3BIIO.dll
  Section Relative Position : .text+000226C7
  Export Relative Position : JMP5IOER+00000E97
[ 4]---------------------------------------------------------------------
  Module File : c:\Program Files\Fujitsu NetCOBOL for Windows\F3BIIO.dll
  Section Relative Position : .text+00002C71
  Export Relative Position : JMP5VSEQ+00002C71
[ 5]---------------------------------------------------------------------
  Module File : c:\Program Files\Fujitsu NetCOBOL for Windows\F3BIIO.dll
  Section Relative Position : .text+00000622
  Export Relative Position : JMP5VSEQ+00000622
[ 6]---------------------------------------------------------------------
  Module File : D:\APL\SAMPDLL2.dll
  Section Relative position : .text+00000298
  Export Relative position : JMP5VSEQ+00000298
[ 7]---------------------------------------------------------------------
  Module File: D:\APL\SAMPDLL2.dll
  Section Relative Position : .text+0000029E
  Export Relative Position : SAMPDLL2+00000266
  Symbol Relative Position : SAMPDLL2+0000029E
  Compilation Information : ASCII, SINGLE THREAD, NOOPTIMIZE
  External Program/Class : SAMPDLL2
  Source File : SAMPDLL2.cob
  Source Line : 31
[ 8]---------------------------------------------------------------------
  Module File: D:\APL\SAMPLE.exe
  Section Relative Position : .text+00000823
  Symbol Relative Position : SAMPLE+00000823
  Compilation Information : ASCII, SINGLE THREAD, NOOPTIMIZE
  External Program/Class : SAMPLE
  Source File : SAMPLE.cob
  Source Line : 33
[ 9]---------------------------------------------------------------------
  Module File : D:\APL\SAMPLE.exe
  Section Relative Position : .text+0000000A
  Export Relative Position : SAMPLE+0000000A
[10]---------------------------------------------------------------------
  Module File : D:\APL\SAMPLE.exe
  Section Relative Position : .text+00000B6A
  Symbol Relative Position : _WinMainCRTStartup+000000CE
[11]---------------------------------------------------------------------
  Module File : C:\Windows\System32\KERNEL32.dll
  Section Relative Position : .text+00015FD7
  Export Relative Position : RegisterWaitForInputIdle+00000049

<<System Information>>
  Computer Name   : MACHINE01
  User Name       : user01
  Windows Version : Microsoft Windows xx
  Version Number  : x.x.xxxx
  Service Pack    : Service Pack x

<<Command Line>>
  "D:\APL\SAMPLE.exe"

<<Environment Variable>>
  @WinCloseMsg=OFF
  @CnsWinSize=(80,24)
  @CBR_ENTRYFILE=ENTRY.DAT
  COMPUTERNAME=MACHINE01
  ComSpec=C:\Windows\system32\cmd.exe
  HOMEDRIVE=C:
  HOMEPATH=\users\default

  LOGONSERVER=\\WORK01
  LIB=C:\Program Files\Fujitsu NetCOBOL for Windows
  NUMBER_OF_PROCESSORS=1
  OS=Windows_xx
  Path=C:\Program Files\Fujitsu NetCOBOL for Windows;C:\Windows\system32;C:Windows;
  PROCESSOR_ARCHITECTURE=x86
  PROCESSOR_IDENTIFIER=x86 Family 15 Model 2 Stepping 9, GenuineIntel
  PROCESSOR_LEVEL=15
  PROCESSOR_REVISION=0209
  SystemDrive=C:
  SystemRoot=C:\Windows
  TEMP=C:\TEMP
  TMP=C:\TEMP
  USERDOMAIN=WIN-DOMAIN
  USERNAME=user01
  USERPROFILE=C:\Documents and Settings\user01
  windir=C:\Windows

<<Execution Environment Information>>

  Runtime System : Vxx.x.x PRODUCT
  Runtime Mode : ASCII, SINGLE THREAD
  Program Name : SAMPLE

  .CBR File    : D:\APL\COBOL85.CBR
    @WinCloseMsg=OFF
    @CnsWinSize=(80,24)
    [EOF]

  @CBR_ENTRYFILE : D:\APL\ENTRY.DAT
    [ENTRY]
    SAMPDLL1=SAMPDLL1.DLL
    SAMPDLL2=SAMPDLL2.DLL
    SAMPDLL3=SAMPDLL3.DLL
    [EOF]
Omitted hereafter
Note <<Summary>>. Reports which runtime message has occurred and in which module.
This example shows that the runtime message JMP0311I-U has occurred in D:\APL\SAMPDLL2.DLL.
Then view <<Detail>>. It tells in which compilation unit the error has occurred.
This example shows that an error has occurred on line 31 in the program SAMPDLL2.
Identify in which statement (instruction) the error has occurred from the source file of the affected program or from the object program listing.
This example assumes that the error has occurred in the OPEN statement on line 31.
Because the information in the initial file is reflected in the environment variables, the file identifier, logical destination definition file, print information file, and so forth, can be identified from the <<Environment Variable>>. Entry information is not reflected in the environment variables. View the contents of the initial file and the entry information file included in the <<Execution Environment Information>> instead.
In this example, check the settings of the environment variables to identify the error of no file being assigned to SYSIN.
Run the interactive debugger as needed to collect detailed information about the error.
Note
The <Call Stack> indicated in the <<Detail>> in a runtime message differs from that in an application error. In the case of an application error, the calling path begins with the program that calls the error-affected program directly. The calling path for a runtime message, on the other hand, starts with the runtime system program. In the example, the error-affected program is SAMPDLL2, and the seventh and subsequent items of information in the <Call Stack> represent the calling relationship of the error-affected program.
Note <<Thread Information>>. It provides information on all threads in the application.
The compilation unit in which the application has paused for each thread can be seen.
Identify in which statement (instruction) the application has paused from the source file of the program or from the object program listing.
Locate roughly the position that did not respond from the source file or the object program listing.
Run the interactive debugger to collect detailed information.
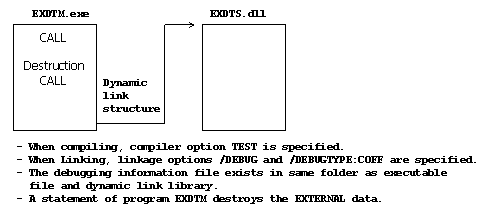
The following is an example diagnostic report generated when watching for area destruction.
The program used in the example consists of the following programs:
NetCOBOL COBOL ERROR REPORT

<<Summary>>
Watched the writing of an area:
Application   : D:\APL\EXDTM.EXE(PID=000000BE)
Start Time    : MM/DD/YYYY(HH:MM:SS)
Watch Address : 00DC1198
Watch Size    : 4bytes

<<1>>==========================================================================
Watch Area : +0 +1 +2 +3
             B8 00 DC 00
Thread ID : 00000070
Module File : C:\Windows\System32\ntdll.dll
Section Relative Position : .text+00003A44
Export Relative Position : RtlAllocateHeap+000003C2

<Call Stack>
[  1]--------------------------------------------------------------------------
Module File : c:\Program Files\Fujitsu NetCOBOL for Windows\F3BIPRCT.dll
Section Relative Position : .text+0002CB05
Export Relative Position : JMP1TMEM+00000295
[  2]--------------------------------------------------------------------------
Module File : c:\Program Files\Fujitsu NetCOBOL for Windows\F3BIPRCT.dll
Section Relative Position : .text+0002298D
Export Relative Position : JMP1EXDT+000005AD
[  3]--------------------------------------------------------------------------
Module File : c:\Program Files\Fujitsu NetCOBOL for Windows\F3BIPRCT.dll
Section Relative Position : .text+0002265A
Export Relative Position : JMP1EXDT+0000027A
[  4]--------------------------------------------------------------------------
Module File : D:\APL\EXDTM.EXE

Section Relative Position : .text+00000162
Symbol Relative Position : EXDTM+00000162
Compilation Information : ASCII, SINGLE THREAD, NOOPTIMIZE
External Program/Class : EXDTM
Source File : Exdtm.cob
Source Line : IN ENTRY-CODE
[  5]--------------------------------------------------------------------------
Module File : D:\APL\EXDTM.EXE
Section Relative Position : .text+0000000A
Symbol Relative Position : EXDTM+0000000A
[  6]--------------------------------------------------------------------------
Module File : D:\APL\EXDTM.EXE
Section Relative Position : .text+0000055C
Symbol Relative Position : _WinMainCRTStartup+000000CE
[  7]--------------------------------------------------------------------------
Module File : C:\Windows\System32\KERNEL32.dll
Section Relative Position : .text+0001AD15
Symbol Relative Position : GetProcessPriorityBoost+00000117

<<2>>==========================================================================
Watch Area : +0 +1 +2 +3
             00 00 00 00
Thread ID : 00000070
Module File : C:\Windows\System32\ntdll.dll
Section Relative Position : .text+00003C85
Export Relative Position : RtlAllocateHeap+00000603

<Call Stack>
[  1]--------------------------------------------------------------------------
Module File : c:\Program Files\Fujitsu NetCOBOL for Windows\F3BIPRCT.dll
SectionRelativePosition:.text+0002CB05
Export Relative Position : JMP1TMEM+00000295
[  2]--------------------------------------------------------------------------
Module File : c:\Program Files\Fujitsu NetCOBOL for Windows\F3BIPRCT.dll
Section Relative Position : .text+0002298D
Export Relative Position : JMP1EXDT+000005AD
[  3]--------------------------------------------------------------------------
Module File : c:\Program Files\Fujitsu NetCOBOL for Windows\F3BIPRCT.dll
Section Relative Position : .text+0002265A
Export Relative Position : JMP1EXDT+0000027A
[  4]--------------------------------------------------------------------------
Module File : D:\APL\EXDTS.DLL
Section Relative Position : .text+00000152
Export Relative Position : EXDTS+0000011E
Symbol Relative Position : EXDTS+00000152
Compilation Information : ASCII, SINGLE THREAD, NOOPTIMIZE
External Program/Class : EXDTS
Source File : Exdts.cob
Source Line : IN ENTRY-CODE


[  5]--------------------------------------------------------------------------
Module File : D:\APL\EXDTM.EXE
Section Relative Position : .text+00000238
Symbol Relative Position : EXDTM+00000238
Compilation Information : ASCII, SINGLE THREAD, NOOPTIMIZE
External Program/Class : EXDTM
Source File : Exdtm.cob
Source Line : 16
[  6]--------------------------------------------------------------------------
Module File : D:\APL\EXDTM.EXE
Section Relative Position : .text+0000000A
Symbol Relative Position : EXDTM+0000000A
[  7]--------------------------------------------------------------------------
Module File : D:\APL\EXDTM.EXE
Section Relative Position : .text+0000055C
Symbol Relative Position : _WinMainCRTStartup+000000CE
[  8]--------------------------------------------------------------------------
Module File : C:\Windows\System32\KERNEL32.dll
Section Relative Position : .text+0001AD15
Export Relative Position : IsProcessorFeaturePresent+00000117

<<3>>==========================================================================
Watch Area : +0 +1 +2 +3
             41 41 41 41
Thread ID : 00000070
Module File : D:\APL\EXDTM.EXE
Section Relative Position : .text+0000034E
Symbol Relative Position : EXDTM+0000034E
Compilation Information : ASCII, SINGLE THREAD, NOOPTIMIZE
External Program/Class : EXDTM
Source File : Exdtm.cob
Source Line : 19

<Call Stack>
[  1]--------------------------------------------------------------------------
Module File : D:\APL\EXDTM.EXE
Section Relative Position : .text+0000000A
Symbol Relative Position : EXDTM+0000000A
[  2]--------------------------------------------------------------------------
Module File : D:\APL\EXDTM.EXE
Section Relative Position : .text+0000055C
Symbol Relative Position : _WinMainCRTStartup+000000CE
[  3]--------------------------------------------------------------------------
Module File : C:\Windows\System32\KERNEL32.dll
Section Relative Position : .text+0001AD15
External Program/Class : IsProcessorFeaturePresent+00000117

<<4>>==========================================================================
The COBOL runtime message occurred:
Exception Number : JMP0071I-U [PID:000000B2 TID:00000085] LIBRARY WORK AREA DESTRUCTION WAS DETECTED. START PGM=EXDTS BRKADR=0x00DC1198.
Thread ID : 00000070

Omitted hereafter
The watched memory areas are checked sequentially starting from the beginning.
The contents written to the watch area and the write locations are given.
Except for when the runtime system writes directly, the COBOL Error Report can generate watch area items for all write operations. As a result, watch area information is generated even for write operations using system functions invoked from the runtime system. In such cases, the callers of the system functions must be checked from the <Call Stack> to determine whether the system function was invoked from the runtime system or an application program.
In this example, it is clear that the watch area contents <<1>> and <<2>> have been written using system functions invoked from the runtime system.
An invalid write can also be identified when runtime message JMP0071I-U occurs.
In this example, checking the diagnostic report ("Diagnostic report" of "5.5 Using the Memory Check Function") when runtime message JMP0071I-U occurred shows that the statement indicated by the third watch area item corrupted the area.
Normally, the watch area information generated immediately before the error information of runtime message JMP0071I-U indicates the program and instructions that corrupted the area.