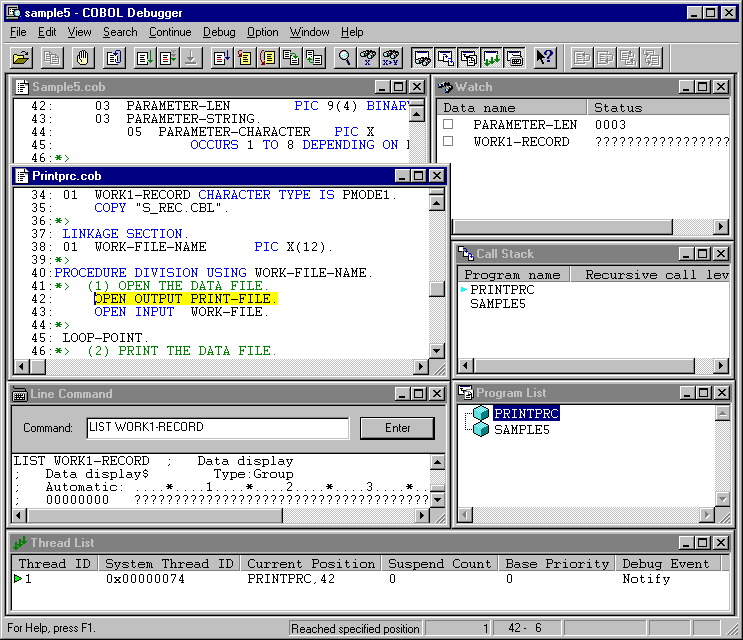
The main window of the debugger contains the Source File window, the Program List window, the Watch window, the Call Stack window, the Thread List window, and the Line Command window. The status bar at the bottom of the window displays program status information and an expanded explanation about the item under the mouse pointer.
The figure below shows an example of the main window.
Figure 2.3 Debugger Main Window

You can invoke debugging operations in five ways:
Using menu commands: Refer to Help for details of each command.
Using accelerator keys: The drop down menus show the accelerator keys beside the functions they invoke.
Using toolbar buttons: Refer to Help for details of each button. You can detach and move the toolbar anywhere in the main window by dragging.
Using the shortcut menu: You display the shortcut menu by clicking the right mouse button. Refer to Help for details on the shortcut menu commands.
Using the Line Command window: You enter commands in this window. Refer to Help for details on the supported line commands.
The Source File window displays the program source and expanded copy libraries. The debugger opens one window for each program being debugged. It opens these windows automatically when execution is interrupted in programs prepared for debugging.
You can use the Program List window to open Source File windows.
You can use the shortcut menu to open library files.
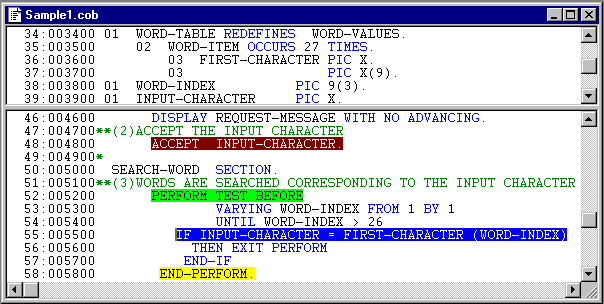
See the figure below for an example of the Source File window.
Figure 2.4 A Split Source File Window

You can use a division bar to split the Source File window and view two parts of the same source file simultaneously. The division bar starts as a small bar, called the split box, at the top of the vertical scroll bar. To split the screen click on the split box and drag it down.
The following statements are displayed in color, which can be changed, so as to distinguish them from other statements:
Current statement - the next statement to be executed: The currently stopped statement is colored. Unless the setup is changed, the current statement color is yellow.
Current trace statement: The currently backward-traced statement is colored. Unless the setup is changed, the backward-traced statement color is blue.
Statement with a breakpoint set: A statement on which a breakpoint is set is colored. Unless the setup is changed, a statement with a breakpoint is colored red.
Statement with a passage count set: When a passage count point is set on a statement, it is colored. (The default setup uses green.) If the program is executed after a passage count point is set, the executed statements will not have a different color from that of already executed statements. If, however, the passage count point is set after execution has begun, a statement not already passed is indicated in green and a statement that has already been passed is indicated in dark green.
The debugger colors the source code to distinguish user-defined text, reserved words and comments.
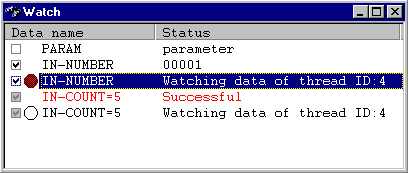
The Watch window displays the following kinds of information:
Data name and contents whose values and contents are monitored to determine if they have been changed
Conditional expressions in which the establishment and status of conditions is monitored
The Watch window opens automatically when data or condition monitoring starts and also appears when "Watch" is selected from the Window menu.
The Watch window is used to identify data changes or monitored conditions or to halt program execution when monitored data change.
More than one set of data or conditions can be programmed for monitoring.
See the figure below for an example of a Watch window.
Figure 2.6 The Watch Window

The Line Command window accepts line commands and displays the results. To display the Line Command window select "Line Command" from the Window menu.
Figure 2.7 The Line Command Window

Refer to "Debugger Command Lists" in Appendix A for a list of line commands.
Refer to Help for detailed specifications of the line commands.
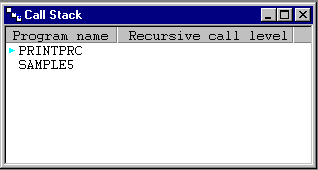
The Call Stack window displays a list of the active programs in the call stack. The program currently being debugged is at the top of the calling path, and calling programs are displayed in sequence. A mark indicating an active program is displayed to the left of the program name.
To display the Call Stack window, select "Call Stack" from the Window menu. The debugging environment can be configured to disable the Call Stack window from being updated while animation is in progress.
The Call Stack window can be used to identify a calling program or to open a source file.
The figure below illustrates a typical Call Stack window.
Figure 2.8 The Call Stack Window

The Thread List window displays a listing of the active threads and the threads from which a thread end event has been received.
To display the Thread List window, select "Thread List" from the Window menu. The debugging environment can be configured to disable the Thread List window from being updated while animation is in progress.
The Thread List window is used to check the status of the active threads or change the implicit thread.
Note
System and server applications may have some threads other than COBOL applications threads. This window displays all thread information (included with their threads) of the process.
See the figure below for an example of a Thread List window.
Figure 2.9 The Thread List Window

The status bar displays the following information:
An expanded explanation of the menu command or toolbar button under the mouse pointer.
The event that interrupted execution.
The thread ID of the current implicit thread.
The cursor position in the Source File window.
Whether the debugger treats lowercase letters as EQUAL or NOT EQUAL to uppercase letters on line commands.
Whether TRACE is on or off.
Whether the operation history log is being written.