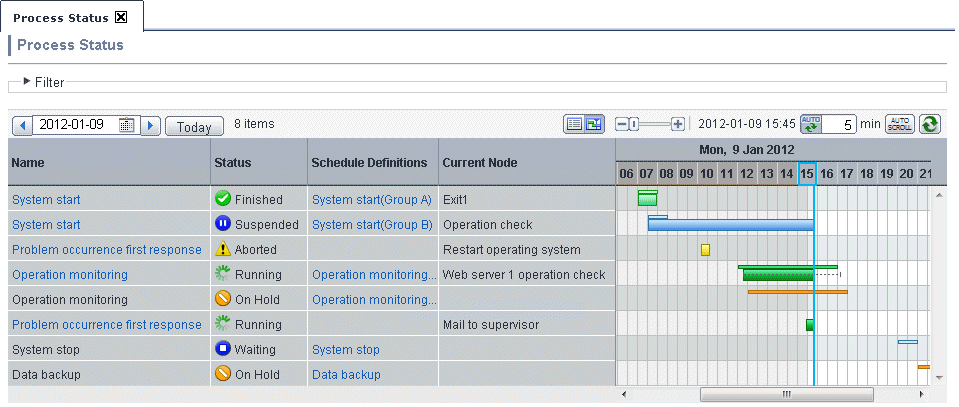
The schedule and performance for an Automated Operation Process can be checked using a Gantt chart. They are displayed on separate lines.
For Gantt charts, a 25-hour chart that includes the current time is displayed. If a time in the past is specified, a chart with historical information is displayed. If a time in the future is specified, a chart with schedule information is displayed.
The procedure used to check the schedule and performance from the Web console is shown below.
Click the Process Status submenu of the Process Management tab.
The schedule and performance for an Automated Operation Process can be checked using the Gantt chart that is displayed.

The schedule and performance of the Automated Operation Process are displayed on separate lines.
The schedule for the Automated Operation Process is displayed in the upper area of the chart, and the performance is displayed in the lower area of the chart. These are also color coded.
To display filtered process instances, click Filter then enter the conditions.
To check a process instance flow, click the process instance name from Name. If the name of an actual process instance is selected, the process instance details will be displayed. If the name of a scheduled process instance is selected, the process definition details will be displayed.
To check a Schedule Definition, click the Schedule Definition name from Schedule Definitions.