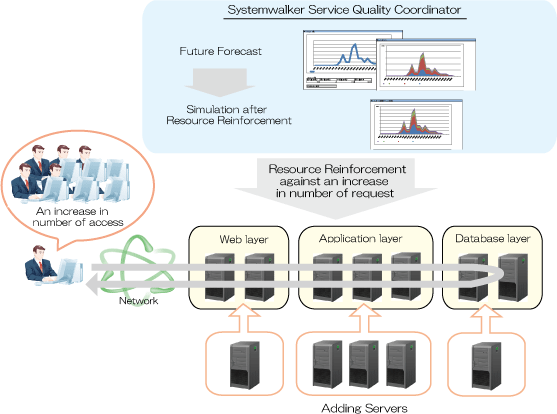
Systemwalker Service Quality Coordinator can predict the future number of requests and perform simulation analysis of the response in the layers that make up a system (e.g., the Web layer, application layer, and database layer), enabling planning for resource expansion and a simulation of the effects of this expansion before it is actually implemented.
This section describes the procedure for simulation using a "Response simulation" category scenario.
Future prediction of request counts
In the Analysis/Planning window, select the "Request count (Future prediction)" report of the "Response simulation" category, specify the analysis conditions and display the report.
Refer to "4.3 Operating the Analysis/Planning Window" for information on how to configure analysis conditions.
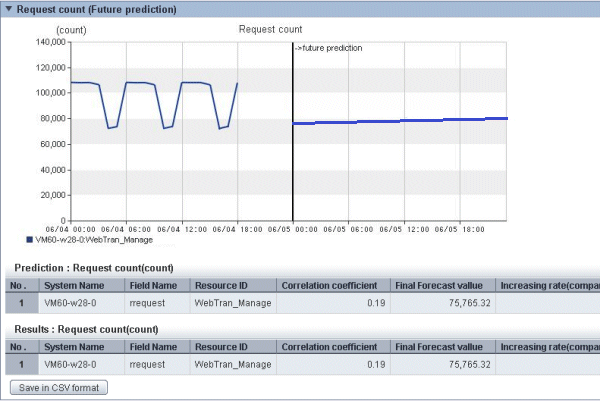
The future prediction results for each service are displayed.
Check the rate of increase in requests compared to the current number of requests.
The rate of increase is used as the request coefficient in the Response simulation (Request increase) report.
Future prediction of response
In the Analysis/Planning window, select the "Response simulation (Request increase)" report of the "Response simulation" category, specify the analysis conditions and display the report.
Refer to "4.3 Operating the Analysis/Planning Window" for information on how to configure analysis conditions.
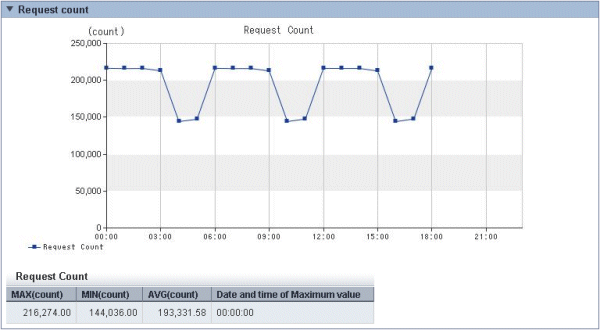
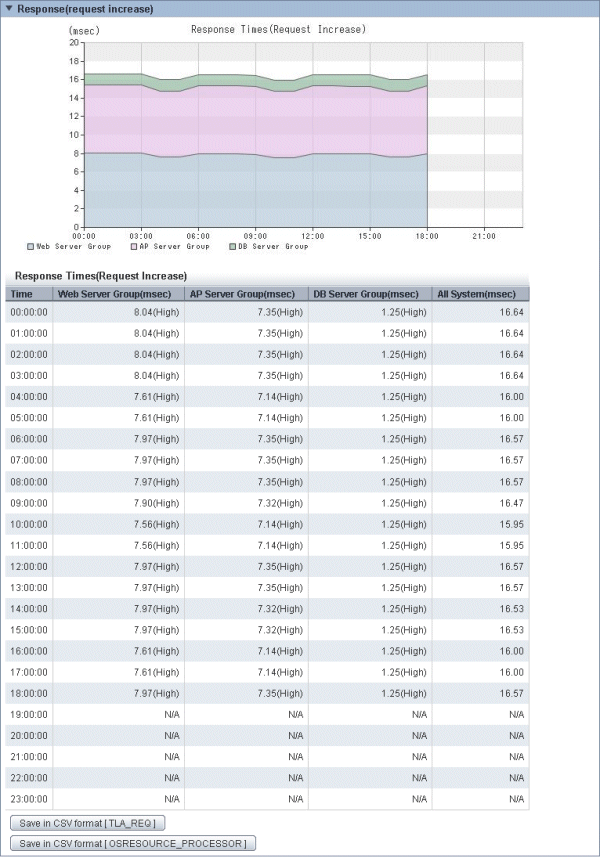
In the "Request count" graph and table, you can see the changes in request counts across a day when there is an increase in the request count. In the "Response" graph and table you can see the response times across the whole system as the request count increases, and also the response times in the layers of the system.
Make sure that response times do not exceed reference values. If there are places where the reference value is exceeded, consider adding servers to the layer where the response times are the longest. Use the number of servers that you are considering adding as an analysis condition in the "Response simulation (Adding servers)" report.
Point
Response simulation is a simulation of response times, achieved by analyzing the relationship between the number of service requests in the past and the performance information (OS) of the various servers. The precision of the simulation can be increased by excluding time periods when batch processes are performed (after hours, for example) that have no bearing on actual request processes.
Confirm the precision of the simulation by looking at the '(High)', '(Medium)', and '(Low)' reliability displayed after the response times in the table.
'(High)' indicates that the simulation was performed with little interference and the precision of the simulation is therefore high.
'N/A' is displayed in the table if the simulation could not be performed because no performance information was found or barely any correlation was achieved between the number of requests and the operating system performance information.
The reliability can be improved by increasing the period in Analysis Conditions, and taking measures to decrease interference by excluding periods when batch work is performed, such as after hours.
Refer to "4.3 Operating the Analysis/Planning Window" for information on how to configure analysis conditions.
Post-resource increase simulation
In the Analysis/Planning window, select the "Response simulation (Adding servers)" report of the "Response simulation" category, set the analysis conditions and display the report.
Refer to "4.3 Operating the Analysis/Planning Window" for information on how to configure analysis conditions.
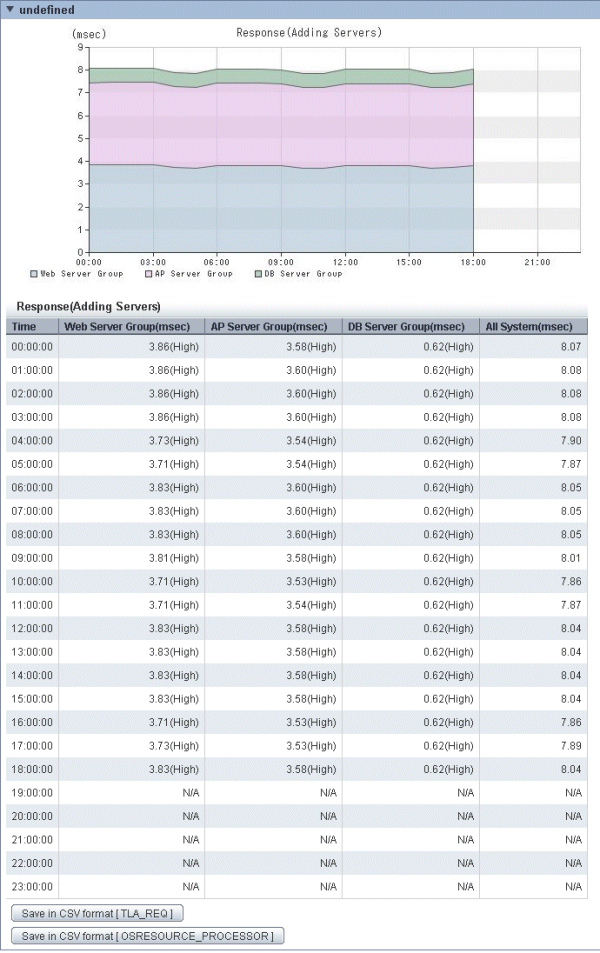
The response times after servers are added are displayed. It is also possible to see where response time is long or where a threshold is greatly exceeded.
When the threshold is exceeded greatly, check the level where the response time is longest, add servers, then run the simulation again.