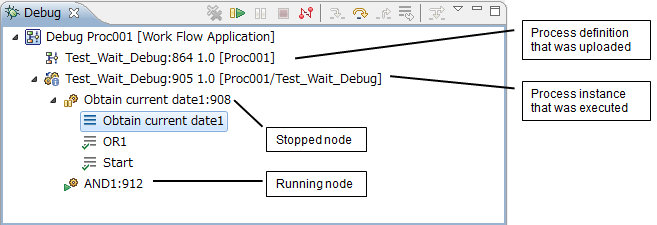
Workflow application debugging is managed in the Debug view. In this view, the nodes which have been executed or suspended (including operation components, when these exist) will be displayed for each process definition process instance to be debugged (the debugging target). Each process instance node is displayed as a tree node.
Tree Node Display Format
The node on the tree is displayed in the following format. (The debugging target is displayed in italics.)
Type | Display format |
|---|---|
Debug configuration |
|
Process definition |
|
Instance |
|
Node or activity |
|
Stack |
|
The Process definition icons are displayed according to the status of the Process definition. They are displayed in the following format.
Image | Description |
|---|---|
| This is a draft status Process definition. |
| This is a public Process definition. |
The instance icons are displayed according to the status of the instance. They are displayed in the following format.
Image | Description |
|---|---|
| This is an instance in which all the nodes are running. |
| This is an instance in which some of the nodes have a no execute status (for example, "suspended"). |
Node icons show the status of nodes:
Image | Description |
|---|---|
| This is a node that is running. |
| This is a node that is suspended. |
| This is a node that is running but which has received a request to suspend. |
| This is a node that is suspended but which has received a request to resume. |
| This is a node that is running. The node has a task. |
| This is a node that is running but which has received a request to suspend. The node has a task. |
| This is a node that has ended normally. |
| This is a node that has ended abnormally. |
| This is a node that was stopped by force. |
The stack displays routes (nodes) executed between the Start Node and the position at which the interruption occurred, in the reverse order of execution times. The node icons displayed for the stack, in accordance with the status of the nodes, are as follows:
Image | Description |
|---|---|
| This is a node that is suspended. |
| This is a node that is running. |
| This is a node that is waiting. |
| This is a node that has ended normally. |
| This is a node that has ended abnormally. |
| This is a node that was stopped by force. |
Note
Stacks are displayed in the reverse order of execution times for each node and not necessarily expressed as the transition from the bottom node to the top node.
If any of the nodes on the route between the Start and interrupted nodes are currently being executed or currently being interrupted, it will not be possible to display the route for the interrupted node correctly.
The Iterator (Parallel) Loop node displays the node generated last.
All nodes generated by the Iterator (Parallel) Loop node must be completed to transition from the Iterator (Parallel) Loop node to the next node.
The Sequential Loop node displays the last node to be executed.
Tree Node Display Order
The order in which each node under the debug configuration node on the tree is displayed is as follows:
Process definition: Displayed in ascending order; not case-sensitive
Instance: Displayed in ascending order of instance identifier ID
Node: Displayed in ascending order of instance identifier ID
Tree Node Display Range
Nodes are displayed on the tree according to the following conditions:
Process definition: The root folder of the project defined in the debug configuration is positioned, and only process definitions which have already been uploaded to the Management Server and have draft status are displayed.
If there are multiple versions of the process definition, only the latest version will be displayed.
Process instance: The root folder of the project defined in the debug configuration is positioned and only process definitions which were instantiated on the Management Server at the time of the server connection and instances started from the Debug view are displayed.
Note
Subprocess nodes or process definitions executed as subprocess by operation components cannot be debugged at the same time. Process definitions that are to be executed as subprocess should be debugged in advance.
Properties for Tree Nodes
The information for nodes displayed in trees is displayed as properties.
Available Operations
In the Debug view, run process instances in step mode and suspend, resume, and disconnect using the following operations.
Image/Button | Name | Description | Location of display |
|---|---|---|---|
| Copy stack | Copies the display string of the selected process instance or node to the Clipboard | Context menu |
| Disconnect | Disconnects the selected process instance or debug configuration from debugging | Context menu and Toolbar |
| Drop to Frame | Cannot be used in Systemwalker Runbook Automation | Context menu and Toolbar |
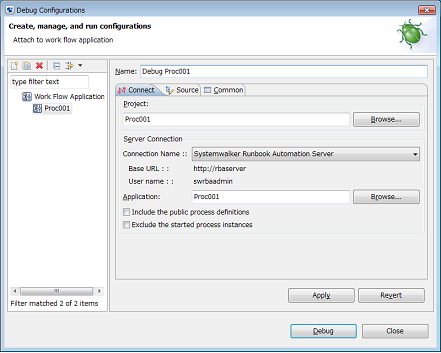
- | Edit [Configuration Name]... | Opens the Debug Configuration dialog box of the associated process flow so that changes can be made
| Context menu |
- | Edit Step Filter... | Cannot be used in Systemwalker Runbook Automation | Context menu |
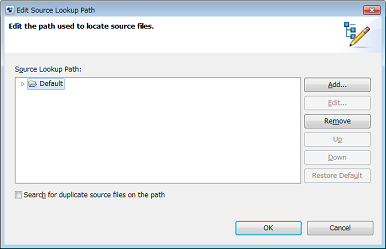
| Edit Source Lookup... | Opens the Edit Source Lookup Path dialog box so that changes can be made; when OK is clicked, the search of the process instance process definition file is executed according to the range/order specified in this dialog box
| Context menu |
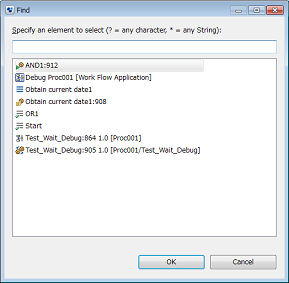
- | Find... | Opens the Find dialog box; clicking OK will select the tree of the selected element on the Debug view
| Context menu |
- | Look Up Source | Source lookup can be executed forcibly | Context menu |
- | Properties | Displays the selected element properties; in Systemwalker Runbook Automation, no information is displayed for the properties | Context menu |
| Remove All Terminated | Clears all completed debugging targets from the view display | Context menu and Toolbar |
| Resume | Resumes stopped node; cannot be used on a completed node | Context menu and Run menu |
| Step Into | Cannot be used in Systemwalker Runbook Automation | Context menu, Run menu, and Toolbar |
| Step Over | Executes stopped node, and pauses automatically at the next node; cannot be used on a completed node | Context menu and Toolbar |
| Step Return | Cannot be used in Systemwalker Runbook Automation | Context menu and Toolbar |
| Suspend | Suspends the running node so that code reference or change, data inspection, and steps can be executed | Context menu, Run menu, and Toolbar |
| Terminate | Cannot be used in Systemwalker Runbook Automation | Context menu and action display |
| Terminate/Disconnect All | Cannot be used in Systemwalker Runbook Automation | Context menu |
| Terminate and Relaunch | Cannot be used in Systemwalker Runbook Automation | Context menu |
| Terminate and Remove | Cannot be used in Systemwalker Runbook Automation | Context menu |
| Use Step Filters | Cannot be used in Systemwalker Runbook Automation | Context menu and Toolbar |
- | Web console | Opens the Systemwalker Runbook Automation Web console | Context menu |
- | Show Task | Opens the Task held by the node | Context menu |
- | Start Instance | Starts the process instance | Context menu |
- | Re-execute node | Re-executes an optional node that ended normally | Context menu |
- | Start Instance by Step Motion | Starts the process instance by step motion | Context menu |
- | Abort instance | Shuts down the process instance | Context menu |
- | Remove instance | Clears the stopped or disconnected process instance | Context menu |