Running a simulation actually displays an animation of the items to be processed arriving at the individual nodes (Activity Node, Subprocess Node, Chained-Process Node, Voting Activity Node, Conditional Node, Complex Conditional Node, Compound Activity) and being sent on to other nodes for processing.
Note
If you simulate a process definition containing a Subprocess Node or Chained-Process Node, you can click the respective tabs of the subprocess definitions in the Scenario Editor and use the Simulation Controller to run the animation of their respective simulations.
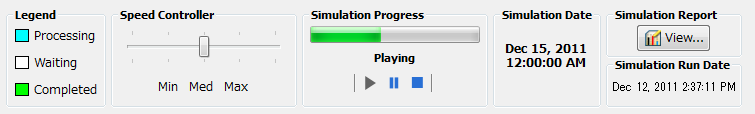
You use the Simulation Controller for starting, pausing or stopping a simulation run, and for generating simulation reports:
Figure 12.11 Simulation Controller
To execute a simulation scenario:
Prepare a simulation, as described in section 12.3.1 Preparing a Simulation Result.
In the Simulation Controller, define the speed with which the processing of the nodes will be animated and displayed. In this way you can control the pace of the simulation: Adjust the slider of the Speed Controller by dragging it to the desired position between Min (minimum pace, e.g. hour by hour), Med (medium pace, for example day by day) to Max (maximum pace, for example an entire week). You can also instantly click Min, Med, or Max.
Click the Play button.
The process definition imported in the selected scenario will be opened in the Scenario editor view. In the following example, the process definition (extension "xpdl") has been imported into the scenario file (extension "ssr"):
Figure 12.12 Simulating a process definition
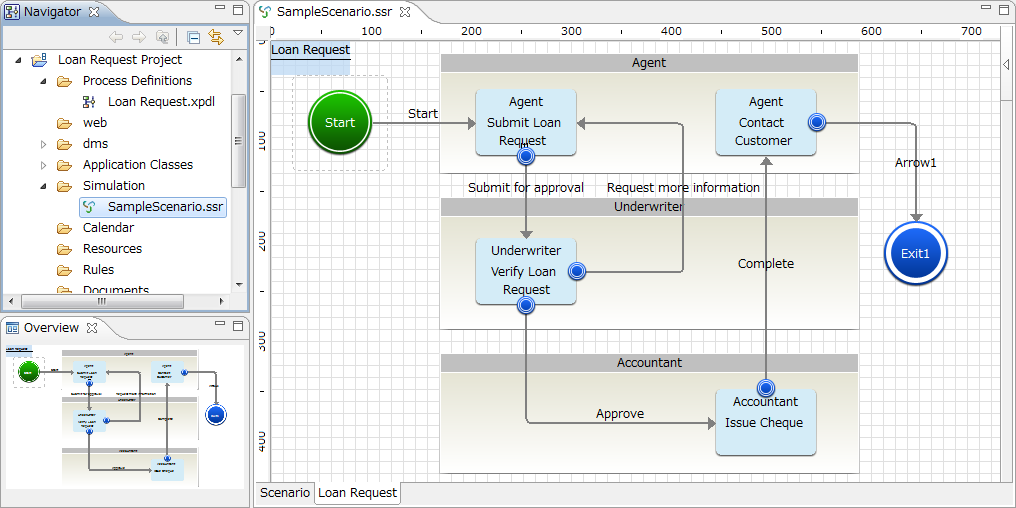
In the course of the simulation run, you can observe the following:
The Simulation Date area in the Simulation Controller shows the virtual date and time of the running simulation. It starts on the start date defined in the simulation scenario and ends on the end date you defined in the scenario.
The Simulation Progress bar indicates the percentage of the simulation that has been completed so far, and the Legend explains the meaning of the Simulation Progress bar colors during simulation animation. The same colors are used for showing the processing status of the individual nodes in the process definition.
The processing of the process definition is animated, The progress of the simulation run is shown for every node, for example whether an activity has been completed, which outgoing arrow has been chosen, how many process instances have been triggered, et cetera.
The arrow transition probability that you define is displayed near each arrow in the process definition.
To pause the execution of the scenario, click the Pause button. To resume the processing again, click the Play button.
Note
To stop the execution, click the Stop button. This will cancel the entire simulation run. The animation of the processing of the process definition is controlled in the Simulation Controller in each tab.
In the Simulation Report area of the Simulation Controller, click View to generate a simulation report.
Refer to section 12.3.3 Generating Simulation Reports for details.