Virtual environment performance information collected by an agent for Agentless Monitoring can be displayed as follows.
Summary
Transaction breakdown analysis information can be displayed by selecting the following nodes in the Summary tree:
"VMware(host)" node (VMware(Physical)Monitor)
"VMware(guest piling)" node (VMware(Virtual)StackMonitor)
Details
Performance information can be displayed by selecting the VMware node in the Detailed tree.
Reports
Vmware
Generic report
Summary
Transaction breakdown analysis information can be displayed by selecting the following nodes in the Summary tree:
" VMware(Cluster)" node (VMware(Cluster)Monitor)
" VMware(ResourcePool)" node (VMware(ResourcePool)Monitor)
Details
Performance information can be displayed by selecting the VMware node in the Detailed tree.
Reports
Vmware
Generic report
Summary
Transaction breakdown analysis information can be displayed by selecting the following nodes in the Summary tree:
"Server resource" node (ServerMonitor),
"Hyper-V(host)" node (HyperV(Physical)Monitor)
"Hyper-V(guest piling)" node (HyperV(Virtual)StackMonitor)
Details
Performance information can be displayed by selecting the "Windows" node and "Hyper-V" node in the Detailed tree.
Reports
Hyper-V
Generic report
Note
The performance information of Windows is also displayed if you make Hyper-V the subject of monitoring.
The following CPU performance information values collected from Hyper-V's host OS (Windows) are not correct, however.
CPU Usage for the ServerMonitor in Summary
CPUBUSY (WIN_CPUBUSY) information for Windows in Drilled-Down
CPU and WIN_CPUBUSY related information for Windows in Report
If it is necessary to check the CPU performance information of the physical server, look at the CPU performance information values collected from Hyper-V.
CPU Usage for HyperV(Physical)Monitor in Summary
HV_CPU information for Hyper-V in Drilled-Down
CPU and HV_CPU related information for Hyper-V in Report
Summary
Transaction breakdown analysis information can be displayed by selecting the following nodes in the Summary tree:
"Server resource" node (ServerMonitor),
"KVM(Virtual machine stack)" node (KVM(Virtual)StackMonitor)
Details
Performance information can be displayed by selecting the "Linux" node and "KVM" node in the Detailed tree.
Reports
Linux Virtualization function (KVM)
Generic report
Note
The performance information of Linux is also displayed if you make the Red Hat virtualized function (KVM) the subject of monitoring.
Summary
Transaction breakdown analysis information can be displayed by selecting the following nodes in the Summary tree:
"Server resource" node (ServerMonitor)
"Xen(guest piling)" node (Xen(Virtual)StackMonitor)
Details
Performance information can be displayed by selecting the "Linux" node and "Xen" node in the Detailed tree.
Reports
Linux Virtualization function (Xen)
Generic report
Note
The performance information of Linux is also displayed if you make the Red Hat virtualized function (Xen) the subject of monitoring.
Summary
Transaction breakdown analysis information can be displayed by selecting the following nodes in the Summary tree:
"Server resource" node (ServerMonitor)
"Solaris Zone(Virtual machine stack)" node (SolarisZone(Virtual)StackMonitor)
Details
Performance information can be displayed by selecting the "Solaris" node and "Zone" node in the Detailed tree.
Reports
Solaris Zone
Generic report
Note
The performance information of Solaris container is also displayed if you make the Solaris container the subject of monitoring.
Note
When this data is to be displayed in the summary window, it will take 10 to 15 minutes for the data to appear.
This is due to the way that the data is collected by the agent for Agentless Monitoring, as described below.
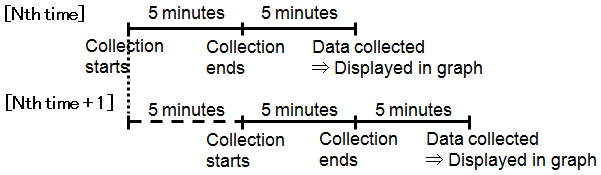
Data for 17:00, for example
17:00 | Begin collection |
17:05 | End collection |
17:10 | Manager/Proxy Manager collects the data |
The first data will appear 15 to 20 minutes after starting the Manager/Proxy Manager service because the script is sent to the monitored server at the timing of the first collection.
When using VMware ESX (through https communication), VMware ESXi, and VMware vCenter, the data of virtual environment is directly collected from Manager/Proxy Manager by API, so the data is collected not delayed like example above.