Function Overview
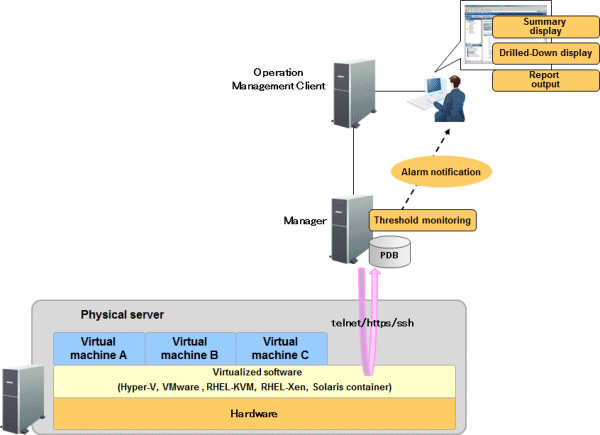
Virtual resource management collects performance information from physical servers and virtual machines of operating systems and virtualized software and centrally manages it.
By comparing the virtual machine performance information collected with this function with performance information about the physical server, overarching decisions can be made to optimize the resources in the server and improve use efficiency.
Performance information for the physical server is displayed as a report. This allows usage of the physical server's CPU, memory, and disk to be seen.
The virtual machine's performance information is stacked for display in reports for each guest. This allows usage of the CPU, memory, and disk to be seen for each guest.

Information that can be collected
Performance information for physical servers and virtual machines is collected by using the agent for Agentless Monitoring functions from virtualized software and connecting remotely through telnet, ssh or https.
Performance information that can be collected depends on the virtualization software to be monitored.
The methods for collecting the performance information of physical servers and virtual machines and the main types of performance information collected by the monitoring virtualized software are described below.
Virtualized software | Physical Server | Virtual Machine |
|---|---|---|
VMware ESX | Performance information for each host (CPU, memory, and disk) is collected from VMware. | Performance information for each guest (CPU, memory, and disk) is collected from VMware. |
VMware ESXi | ||
VMware vCenter | Performance information for each cluster, resource pool, and data store is collected from VMware. | |
Hyper-V | CPU performance information is collected from Hyper-V. | CPU performance information is collected from Hyper-V. |
Red Hat virtualization function(KVM) | CPU, memory, and disk performance information is collected from the host OS (Linux). | CPU, memory, and disk performance information is collected from Red Hat virtualization function (KVM). |
Red Hat virtualization function (Xen) | CPU, memory, and disk performance information is collected from the host OS (Linux). | CPU, memory, and disk performance information is collected from Red Hat virtualization function (Xen). |
Solaris Containers | CPU, memory, and disk performance information is collected from the host OS (Solaris). | CPU and memory performance information is collected from Global Zone. |
Note
The performance information of the host OS (Windows) is also collected if you make Hyper-V the subject of monitoring.
The CPU performance information values collected from Hyper-V's host OS (Windows) are not correct, however. If it is necessary to check the CPU performance information of the physical server, look at the CPU performance information values collected from Hyper-V.
The performance information of the host OS (Linux) is also collected if you make the Red Hat virtualized function (Xen) and Red Hat virtualization function(KVM) the subject of monitoring.
The performance information of Solaris of the Global Zone is also collected if you make Solaris Containers the subject of monitoring.
The virtual machine's resources are stacked for display in a report.
Threshold monitoring can be performed on the different pieces of information and notifications can be sent as alarms when a monitored item exceeds a defined value.
Information Collection Differences between VMware ESX, VMware ESXi and VMware vCenter
In information collection from VMware ESX, VMware ESXi, and VMware vCenter, the SOAP API is used to collect direct virtualization software information through https communication. In https communication, data can be displayed in real time, without the delay in data display associated with ssh communication.
In VMware ESX, an information collection method using ssh communication can also be used for compatibility with old versions. Using this method, information is collected by using ssh to log in to the remote console of the virtual environment and then executing the command on the virtual environment. It causes the delay of displaying as shown at "Notes" in "2.2.4 Display".
Collection interval
Collection interval is 5 minutes.
Procedure
Steps for setting an agent for Agentless Monitoring to manage virtual resources are described below.