Systemwalker Service Quality Coordinator Dashboard templates offer the following views that allow you to monitor information from the Systemwalker Service Quality Coordinator:
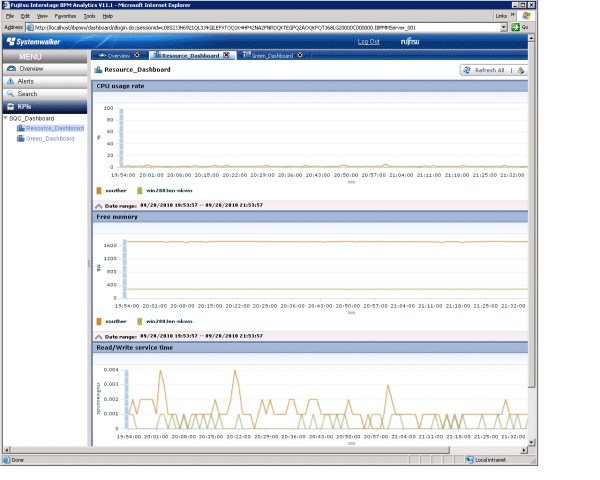
This view monitors resource information (CPU, memory, and disk).

Graph title | Displayed data | Displayed period | Remarks |
|---|---|---|---|
CPU usage rate | Record name: SUM_PROC | 2 hours | Displayed for each system |
Free memory | Record name: SUM_MEM | 2 hours | Displayed for each system |
Read/Write service time | Record name: SUM_DISK | 2 hours | Displayed for each system |
Note
When you display in line graphs information collected at different intervals from different agents (for example information from a server with an Agent installed and information from a server being monitored by an agent for Agentless Monitoring), the line for the agent whose collection interval is larger might be corrupted.
If you need to display information in a graph from agents that have different collection intervals, use the plot calibration function found in the Analytics Studio under Chart >> Options, and set the plotting interval so that it matches the largest collection interval.
For example, for SUM_PROC_totproc prepared as a template:
Agent for Agent-based Monitoring: One-minute intervals
Agent for Agentless Monitoring: Five-minute intervals
Displayed period: 2 hours
For the above conditions, set the "Upper plotting limit for items" in "Plot calibration" to 24.
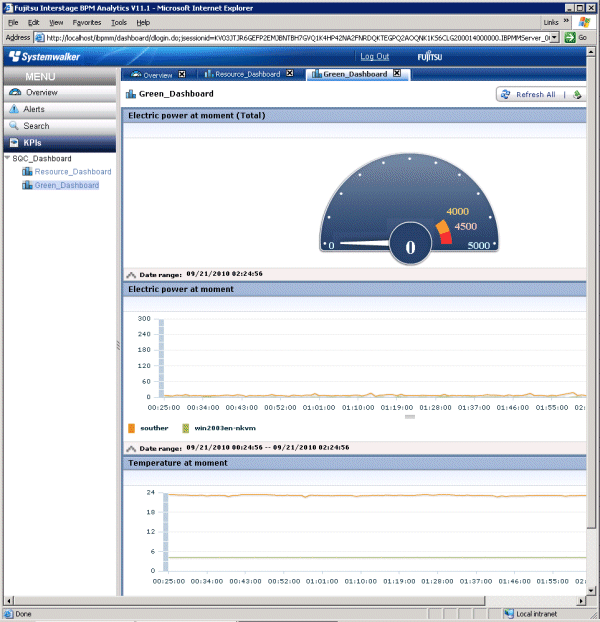
This view monitors machine power consumption and temperature.

Graph title | Displayed data | Displayed period | Remarks |
|---|---|---|---|
Electric power at moment (Total) | Record name: ECO_POWER | Latest value | Sum total of the whole system |
Electric power at moment | Record name: ECO_POWER | 2 hours | Displayed for each resource ID |
Temperature at moment | Record name: ECO_TEMPERATURE | 2 hours | Displayed for each resource ID |
*1: Change to match the operating environment.
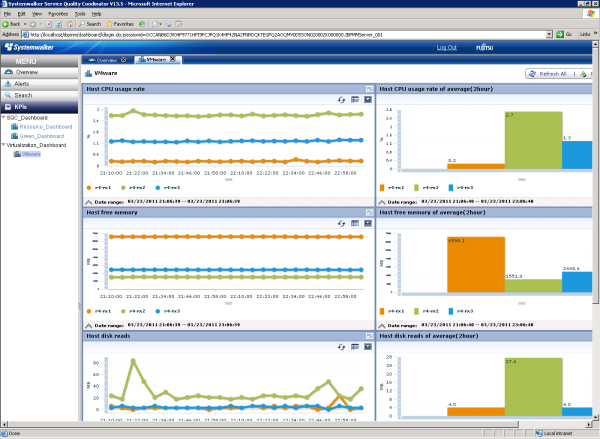
Sample of the view to observe the server resource of VMware host and guest servers. This sample dashboard is included in "T02-VirtualServer Template".

Graph title | Displayed data | Displayed period | Remarks |
|---|---|---|---|
Host CPU usage rate | Record name: SUM_VMWPPROC | 2 hours | Displayed for each system |
Host CPU usage rate of average(2hour) | Record name: SUM_VMWPPROC | 2 hours (average) | Displayed for each system Capable of drill-down to [Guest CPU usage rate] from the graph. |
Host free memory | Record name: SUM_VMWPMEM | 2 hours | Displayed for each system |
Host free memory of average(2hour) | Record name: SUM_VMWPMEM | 2 hours (average) | Displayed for each system Capable of drill-down to [Guest memory usage] from the graph. |
Host disk reads | Record name: SUM_VMWPDISK | 2 hours | Displayed for each system |
Host disk reads of average(2hour) | Record name: SUM_VMWPDISK | 2 hours (average) | Displayed for each system Capable of drill-down to [Guest disk reads] from the graph. |
Host disk writes | Record name: SUM_VMWPDISK | 2 hours | Displayed for each system |
Host disk writes of average(2hour) | Record name: SUM_VMWPDISK | 2 hours (average) | Displayed for each system Capable of drill-down to [Guest disk writes] from the graph. |
Guest CPU usage rate | Record name: SUM_VMWVPROC | 2 hours | Displayed for each guest |
Guest memory usage | Record name: SUM_VMWVMEM | 2 hours | Displayed for each guest |
Guest disk reads | Record name: SUM_VMWVDISK | 2 hours | Displayed for each guest |
Guest disk writes | Record name: SUM_VMWVDISK | 2 hours | Displayed for each guest |
If you want to monitor information other than that included in the templates, customize your templates by referring to "4.1.3 Customizing of Dashboard Templates".