This section explains how to display power consumption data as graphs.
The power consumption data for each power monitoring target that is registered in the power monitoring environment can be displayed as graphs.
The collected power consumption data and average values of the specified time span and rate can be displayed in line graphs.
Use the following procedure to display power consumption data as graphs.
Select [Tools]-[Environmental Data Graph] from the ROR console menu.
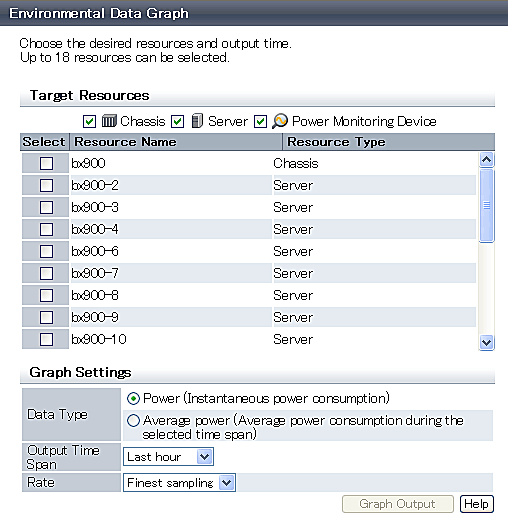
The [Environmental Data Graph] dialog is displayed.
Set the following items:
Figure 13.2 [Environmental Data Graph] dialog

Specify the power monitoring target name to display the power consumption data graph of.
Select the checkboxes of each desired target.
Up to 18 targets can be selected.
Specify the type of data to display the graph.
Specify either one of the following for the data type:
- Power (Instantaneous power consumption)
- Average power (Average power consumption during the selected time span)
Select the time span for the data from the drop-down menu.
Select one of the following options:
- Last hour
- Last day
- Last week
- Last month
- Last year
- Custom
When "Custom" is selected, the following fields must all be specified:
- Start day
- Start time
- End day
- End time
Select the graph output interval to export from the drop-down menu.
Select one of the following options:
- Finest sampling
- Hourly
- Daily
- Monthly
- Annual
Click <Graph Output>.
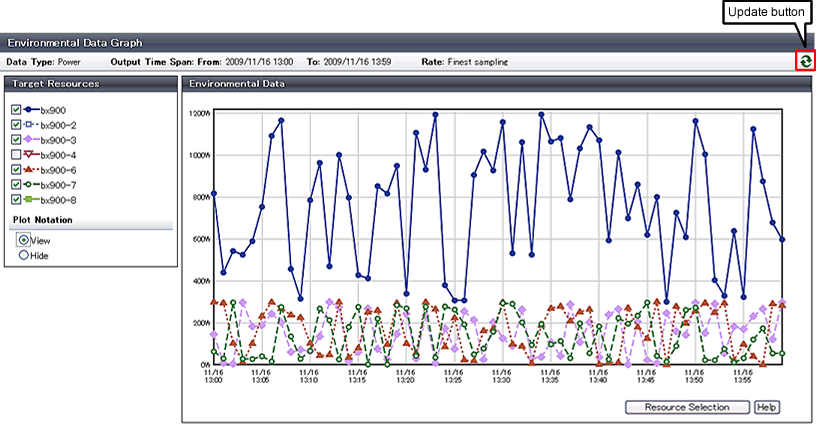
After switching to the graph display window, the selected power consumption data can be displayed in line graphs.
Figure 13.3 Graph Display Window

The following operations can be performed from the graph display window.
Switching resource display
By selecting and clearing the checkbox of the [Target Resources], it is possible to display or hide the corresponding graph.
Switching plot symbol display
Selecting the [View] or [Hide] radio button of [Plot Notation] switches between displaying and hiding plot symbols in line graphs.
Data update
Clicking the update button on the upper right of the screen updates the displayed graph.
Return to resource selection window.
Clicking <Resource Selection> displays the [Environmental Data Graph] dialog.
Note
If you change the size of the web browser when displaying graphs, click the update button after doing so.