Referencing the Tier pool access status chart to check the tendency of the IOPS value can evaluate whether performance can be improved and disk usage can be optimized with the introduction of Automated Storage Tiering.
Clicking the graph area displays a vertical auxiliary line at that location, and in Capacity and I/O Rate at the top right panel, the total value from the left of the auxiliary line is displayed. High sub-pool capacities required to move to a multiple-layer (two or more) Tier pool can be checked from Capacity. Also, from I/O Rate, the rate of IOPS that can be processed a High tiering level can be checked.
When FTRPEs with high IOPSs are concentrated in a single part of the graph area, performance improvements can be expected by introducing Automated Storage Tiering.
Example
The following example describes how to calculate the High sub-pool capacity required to move to a multiple-layer Tier pool.
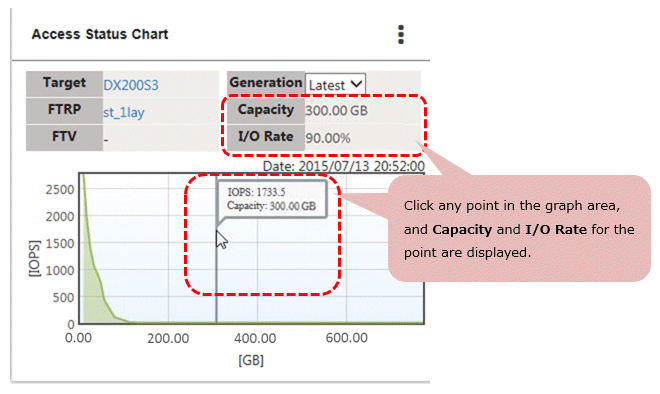
Click the graph area to search for a part where the I/O Rate is 90 %.
Check the value displayed in Capacity. That value is the required capacity for the High sub-pool.
Note
In an FTV access status chart, only the IOPS produced in the target FTV can be checked.
Graph data of the access status chart is created at 2:00 after Automated Storage Tiering starts. (The time listed on the left or later is an interval of IOPS calculation period.)
However, no data of the access status chart is displayed for the following cases:
If data has never been created.
If no access status data exists in the IOPS calculation period or evaluation period.
Since the access status chart displays only the data of an I/O generated area, the maximum capacity value on the horizontal axis may not agree with the used capacity in a pool or FTV.