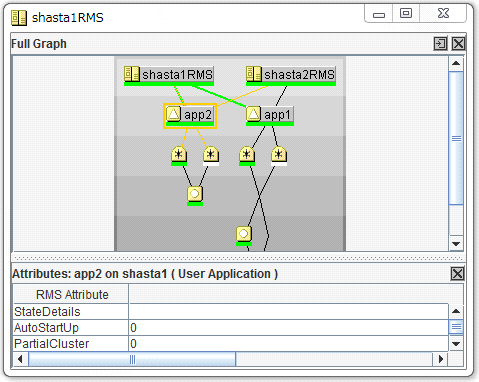
To display the RMS full graph, right-click on any system node and select View Graph from the context menu.
Figure 6.9 Viewing the RMS full graph on a node
Note
The View Graph menu item is not available if a graph is already open for that node.
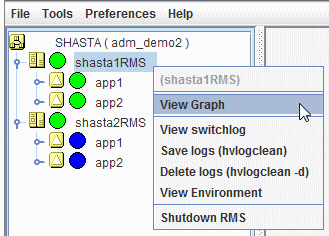
By default, each graph appears as a separate tab in the right pane of the Cluster Admin view.
Figure 6.10 RMS full graph on a node - tab view
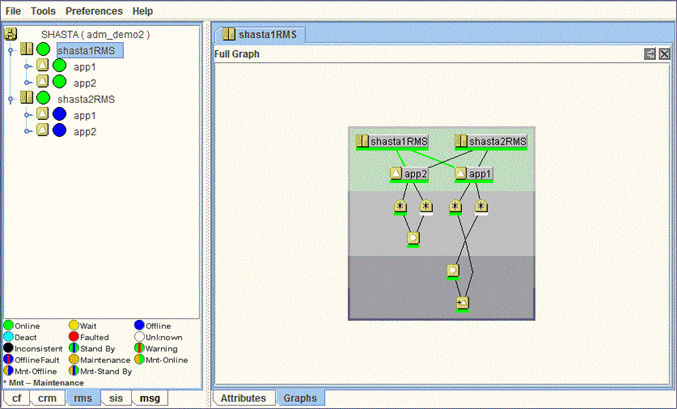
To view any tab in a separate window, click the detach control button. The detach button is located next to the close control button in the upper-right corner of the view.
Figure 6.11 Detail of tab view showing detach button
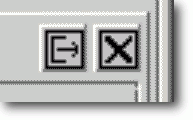
The detached view contains the same information as the tabbed view.
Figure 6.12 RMS full graph on a node - separate window view
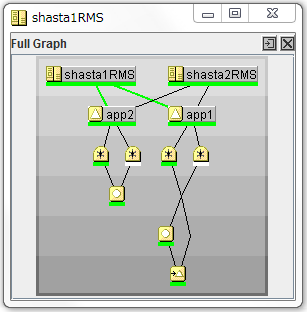
To rejoin the detached window to the Cluster Admin view, click the attach control button. The attach button is located next to the view's close control button in the upper-right corner, just below the standard window control buttons.
Figure 6.13 Detail of separate window view showing attach button
The RMS full graph displays the complete RMS configuration of the cluster and represents the following items:
Node where each application is currently online, indicated by green lines between the node and application objects
Object types, indicated by the object's icon
Current object state, indicated by the colored bar beneath each icon
Relationships between objects
Dependencies of objects
The RMS graph is drawn from the perspective of the selected node; that is, the state information of all other objects is displayed according to the reports received by that node. The node name in the title bar of the graph identifies the node that is supplying the state information. You can create an RMS graph from the perspective of any node in the cluster.
The background of the graph is shaded from top to bottom with progressively darker gray bands. In large, complicated graphs, this can help to locate objects and identify their dependency level.
If you position the mouse cursor over an object in the graph, the cursor changes to a crosshair and the object's name appears as a tool tip. Also, the connector lines radiating from the object are highlighted with yellow to indicate its parent and child dependencies.
Figure 6.14 RMS full graph - object tooltip
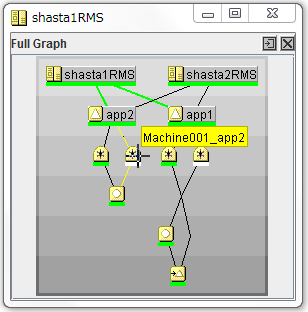
Clicking on the object brings up a window with further details such as the object's attributes.
Figure 6.15 RMS full graph - object details
