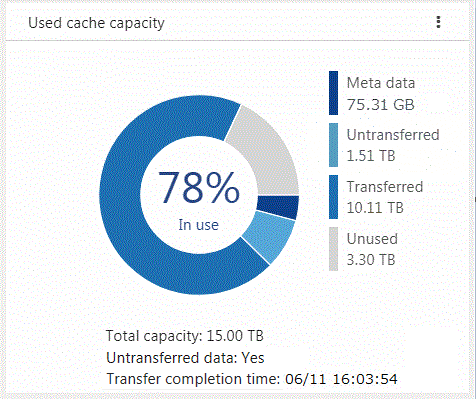
The cache usage is displayed on the Used cache capacity panel of the CSG Web GUI dashboard.
Figure 4.5 Example of Information Displayed on the Used Cache Capacity Panel

Used cache capacity is displayed as a pie chart. The values of "Meta data", "Untransferred", "Transferred", "Unused", and "Total capacity" are displayed to the second decimal point.
When the datastore is not registered, a pie chart and legend are not displayed.
Item | Description |
|---|---|
Meta data | Displays the Meta data capacity, which is data used for the management of file systems, deduplication/compression, and as a data storage destination used by the cloud provider. |
Untransferred | Displays the total capacity of the data in the cache but not yet transferred to the cloud provider. |
Transferred | Displays the total capacity of the data in the cache and transferred to the cloud provider. |
Unused | Displays the capacity of areas that are reserved for cache but not yet used. |
In use(%) | Displays the rate of the used amount (the total value for Meta data, Untransferred, and Transferred) among the areas that are reserved for the cache area as a percentage. |
Total capacity | Displays the size of areas reserved for cache. |
Untransferred data | The presence/absence of data that is untransferred to the cloud provider is indicated by Yes/No. When the datastore is not registered, a hyphen (-) is displayed. |
Transfer completion time | Displays the time when Untransferred data changes to "No". |
Note
Values displayed in Transferred differ from the values displayed in In use in the Used datastore capacity panel.
Transferred indicates the capacity of data that is kept as cache from all the data transferred to the cloud provider.
Data transfers to the cloud provider are performed sequentially, but if the file is created or deleted intermittently, or if data is written, the transfer completion time may not be updated because the Untransferred data does not change to "None".